R Notebook
Last updated: 2019-01-01
workflowr checks: (Click a bullet for more information)-
✔ R Markdown file: up-to-date
Great! Since the R Markdown file has been committed to the Git repository, you know the exact version of the code that produced these results.
-
✔ Environment: empty
Great job! The global environment was empty. Objects defined in the global environment can affect the analysis in your R Markdown file in unknown ways. For reproduciblity it’s best to always run the code in an empty environment.
-
✔ Seed:
set.seed(20181026)The command
set.seed(20181026)was run prior to running the code in the R Markdown file. Setting a seed ensures that any results that rely on randomness, e.g. subsampling or permutations, are reproducible. -
✔ Session information: recorded
Great job! Recording the operating system, R version, and package versions is critical for reproducibility.
-
Great! You are using Git for version control. Tracking code development and connecting the code version to the results is critical for reproducibility. The version displayed above was the version of the Git repository at the time these results were generated.✔ Repository version: a7860ef
Note that you need to be careful to ensure that all relevant files for the analysis have been committed to Git prior to generating the results (you can usewflow_publishorwflow_git_commit). workflowr only checks the R Markdown file, but you know if there are other scripts or data files that it depends on. Below is the status of the Git repository when the results were generated:
Note that any generated files, e.g. HTML, png, CSS, etc., are not included in this status report because it is ok for generated content to have uncommitted changes.Ignored files: Ignored: code/.ipynb_checkpoints/ Ignored: output/10x-180504 Ignored: output/10x-180504-aligned Ignored: output/10x-180504-aligned-metageneplot Ignored: output/10x-180504-beforeQC Ignored: output/10x-180504-beforeqc Ignored: output/10x-180504-cca-discardedcells Ignored: output/10x-180504-ccregout Ignored: output/10x-180504-ccregout-aligned Ignored: output/10x-180504-ccregout-cca-discardedcells Ignored: output/10x-180831 Ignored: output/10x-180831-T1T2T3 Ignored: output/10x-180831-T4T5 Ignored: output/10x-180831-beforeqc Ignored: output/10x-180831-notcleaned Ignored: output/monocle/ Untracked files: Untracked: tables/10x-180504-scmap-numbers
Expand here to see past versions:
library(Seurat)Loading required package: ggplot2Loading required package: cowplot
Attaching package: 'cowplot'The following object is masked from 'package:ggplot2':
ggsaveLoading required package: Matrixlibrary(scmap)Creating a generic function for 'toJSON' from package 'jsonlite' in package 'googleVis'library(SingleCellExperiment)Loading required package: SummarizedExperimentLoading required package: GenomicRangesLoading required package: stats4Loading required package: BiocGenericsLoading required package: parallel
Attaching package: 'BiocGenerics'The following objects are masked from 'package:parallel':
clusterApply, clusterApplyLB, clusterCall, clusterEvalQ,
clusterExport, clusterMap, parApply, parCapply, parLapply,
parLapplyLB, parRapply, parSapply, parSapplyLBThe following objects are masked from 'package:Matrix':
colMeans, colSums, rowMeans, rowSums, whichThe following objects are masked from 'package:stats':
IQR, mad, sd, var, xtabsThe following objects are masked from 'package:base':
anyDuplicated, append, as.data.frame, cbind, colMeans,
colnames, colSums, do.call, duplicated, eval, evalq, Filter,
Find, get, grep, grepl, intersect, is.unsorted, lapply,
lengths, Map, mapply, match, mget, order, paste, pmax,
pmax.int, pmin, pmin.int, Position, rank, rbind, Reduce,
rowMeans, rownames, rowSums, sapply, setdiff, sort, table,
tapply, union, unique, unsplit, which, which.max, which.minLoading required package: S4Vectors
Attaching package: 'S4Vectors'The following object is masked from 'package:Matrix':
expandThe following object is masked from 'package:base':
expand.gridLoading required package: IRangesLoading required package: GenomeInfoDbLoading required package: BiobaseWelcome to Bioconductor
Vignettes contain introductory material; view with
'browseVignettes()'. To cite Bioconductor, see
'citation("Biobase")', and for packages 'citation("pkgname")'.Loading required package: DelayedArrayLoading required package: matrixStats
Attaching package: 'matrixStats'The following objects are masked from 'package:Biobase':
anyMissing, rowMedians
Attaching package: 'DelayedArray'The following objects are masked from 'package:matrixStats':
colMaxs, colMins, colRanges, rowMaxs, rowMins, rowRangesThe following object is masked from 'package:base':
applylibrary(dplyr)
Attaching package: 'dplyr'The following object is masked from 'package:matrixStats':
countThe following object is masked from 'package:Biobase':
combineThe following objects are masked from 'package:GenomicRanges':
intersect, setdiff, unionThe following object is masked from 'package:GenomeInfoDb':
intersectThe following objects are masked from 'package:IRanges':
collapse, desc, intersect, setdiff, slice, unionThe following objects are masked from 'package:S4Vectors':
first, intersect, rename, setdiff, setequal, unionThe following objects are masked from 'package:BiocGenerics':
combine, intersect, setdiff, unionThe following objects are masked from 'package:stats':
filter, lagThe following objects are masked from 'package:base':
intersect, setdiff, setequal, unionData loading and inspection of the metadata.
load('/data/pub-others/tabula_muris/figshare/180126-facs/maca.seurat_obj.facs.figshare_180126.RData')
head(seurat_obj@meta.data)
nGene nUMI orig.ident cell
A12.D041914.3_8_M.1.1 4712 1221663 SeuratProject A12.D041914.3_8_M.1.1
B16.D041914.3_8_M.1.1 3652 1837897 SeuratProject B16.D041914.3_8_M.1.1
C18.D041914.3_8_M.1.1 6220 1703523 SeuratProject C18.D041914.3_8_M.1.1
D22.D041914.3_8_M.1.1 5322 949162 SeuratProject D22.D041914.3_8_M.1.1
F4.D041914.3_8_M.1.1 3036 59975 SeuratProject F4.D041914.3_8_M.1.1
C19.D041914.3_8_M.1.1 5350 808935 SeuratProject C19.D041914.3_8_M.1.1
tissue cell_ontology_class cell_ontology_id
A12.D041914.3_8_M.1.1 Bladder mesenchymal cell CL:0008019
B16.D041914.3_8_M.1.1 Bladder bladder cell CL:1001319
C18.D041914.3_8_M.1.1 Bladder bladder cell CL:1001319
D22.D041914.3_8_M.1.1 Bladder bladder cell CL:1001319
F4.D041914.3_8_M.1.1 Bladder mesenchymal cell CL:0008019
C19.D041914.3_8_M.1.1 Bladder bladder cell CL:1001319
tissue_cell_type
A12.D041914.3_8_M.1.1 Bladder_mesenchymal cell
B16.D041914.3_8_M.1.1 Bladder_bladder cell
C18.D041914.3_8_M.1.1 Bladder_bladder cell
D22.D041914.3_8_M.1.1 Bladder_bladder cell
F4.D041914.3_8_M.1.1 Bladder_mesenchymal cell
C19.D041914.3_8_M.1.1 Bladder_bladder cellsce_maca <- as.SingleCellExperiment(seurat_obj)
all10x <- readRDS('output/10x-180504')
sce_10x <- as.SingleCellExperiment(all10x)
#convert maca gene names to uppercase to match 10x gene names
rowData(sce_maca)['feature_symbol'] <- unlist(lapply(rowData(sce_maca)$gene, function(x){return(toupper(x))}))
rowData(sce_10x)['feature_symbol'] <- rowData(sce_10x)$gene
counts(sce_10x) <- as.matrix(counts(sce_10x))
logcounts(sce_10x) <- as.matrix(logcounts(sce_10x))
counts(sce_maca) <- as.matrix(counts(sce_maca))
logcounts(sce_maca) <- as.matrix(logcounts(sce_maca))
sce_maca <- selectFeatures(sce_maca, suppress_plot = FALSE)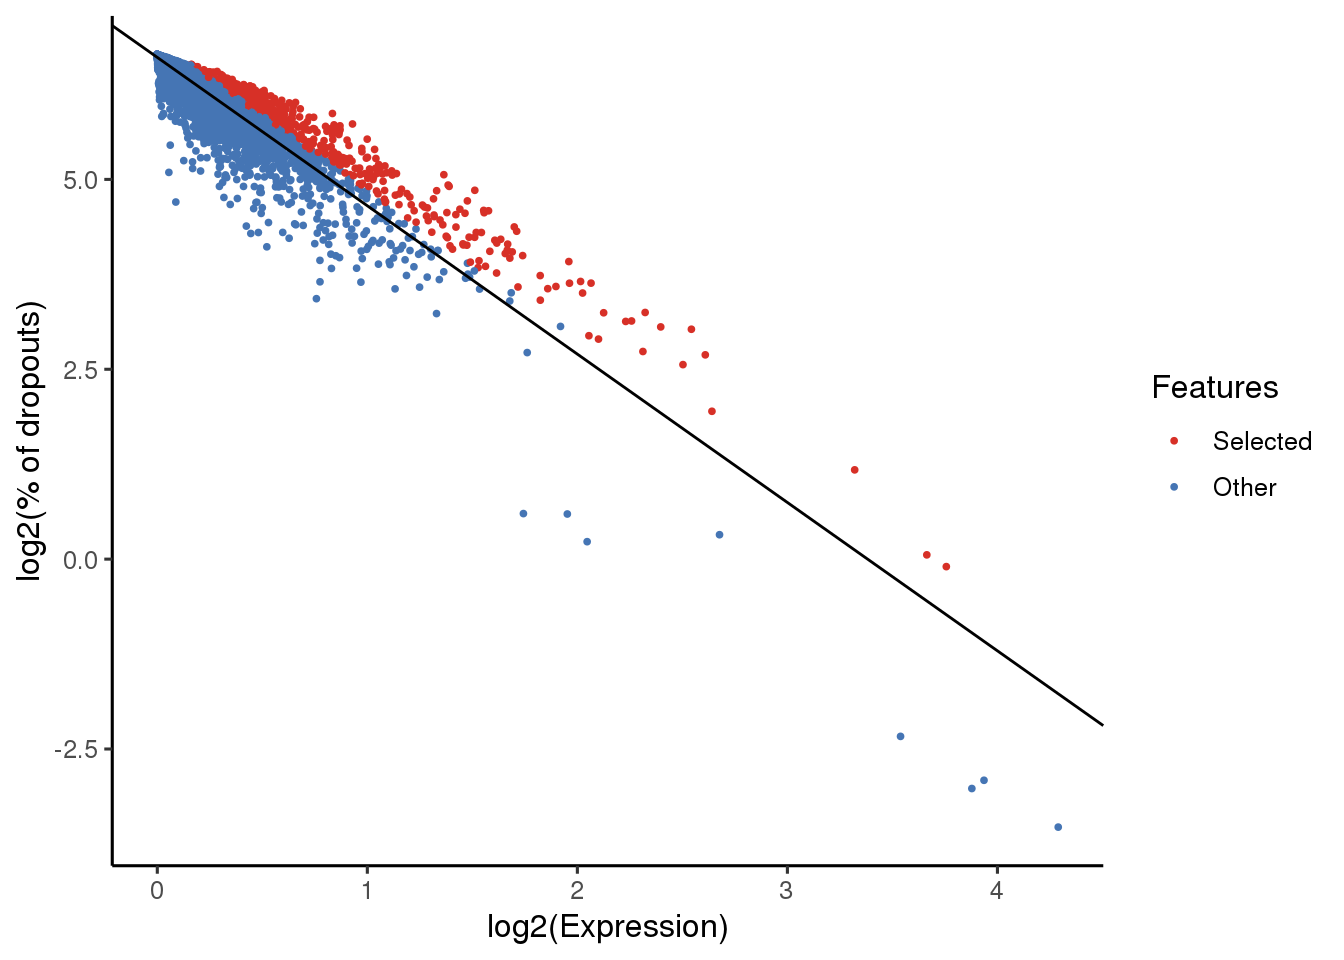
Celltypes in the fat dataset
seurat_obj@meta.data %>% filter(tissue=="Fat") %>% distinct(tissue_cell_type) tissue_cell_type
1 Fat_myeloid cell
2 Fat_T cell
3 Fat_B cell
4 Fat_granulocyte
5 Fat_mesenchymal stem cell of adipose
6 Fat_endothelial cell
7 Fat_natural killer cell
8 Fat_epithelial cell
9 Fat_neutrophil
10 Fat_smooth muscle cellSubsetting and preparing the data.
maca_fat <- SubsetData(SetAllIdent(seurat_obj, id='tissue'), ident.use="Fat")
sce_maca_fat <- as.SingleCellExperiment(maca_fat)
rowData(sce_maca_fat)['feature_symbol'] <- unlist(lapply(rowData(sce_maca_fat)$gene, function(x){return(toupper(x))}))
counts(sce_maca_fat) <- as.matrix(counts(sce_maca_fat))
logcounts(sce_maca_fat) <- as.matrix(logcounts(sce_maca_fat))
sce_maca_fat <- selectFeatures(sce_maca_fat, suppress_plot = FALSE)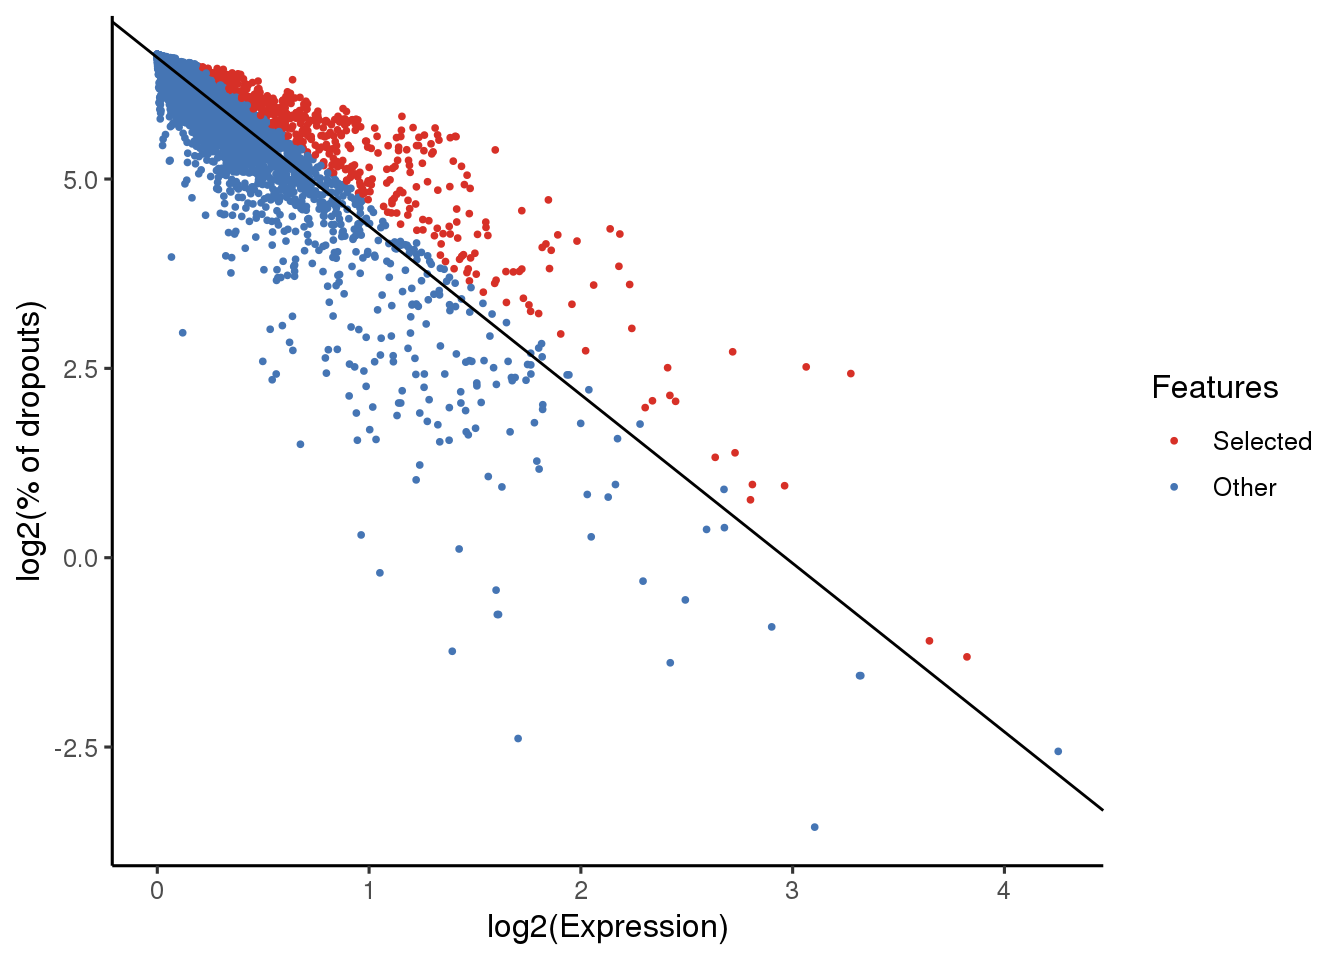
Setting the right column for clustering.
sce_maca_fat <- indexCluster(sce_maca_fat, cluster_col = 'cell_ontology_class')Predicting cell types in our dataset.
scmapCluster_results_fat <- scmapCluster(
  projection = sce_10x,
  index_list = list(
    sce_maca_fat = metadata(sce_maca_fat)$scmap_cluster_index
  ),
  threshold=0.5  #default=0.7
)
Warning in setFeatures(projection, rownames(index)): Features
1190002H23RIK, 8430408G22RIK, ADH1, AW112010, C1RA, C4B, CAR4, CCL6,
CCL9, CCR2, CD2, CD24A, CD48, CD53, CXCR7, CYB5, CYBB, CYP4B1, CYP4F18,
ERCC-00009, ERCC-00108, F13A1, FCGR2B, FCGR3, GIMAP3, GIMAP6, GM11428,
GPIHBP1, H2-AA, H2-AB1, H2-D1, H2-DMA, H2-DMB1, H2-DMB2, H2-EB1, H2-K1, H2-
OB, H2-Q6, HMGCS2, IFI205, IFI27L2A, IL11RA1, LILRB4, LRRC33, LY6A, LY6C1,
LY86, LYZ2, MGL2, MMP23, MRC1, MS4A1, MS4A4B, MS4A4C, MS4A4D, MS4A6B,
MS4A6C, MT1, NEURL3, PECAM1, PGCP, RETNLA, SERPINB6A, SFPI1, SLFN2, SPNB2,
TPRGL, TRF are not present in the 'SCESet' object and therefore were not
set.Number of predictions for each annotation for the whole dataset and for the mixture cluster.
pred_fat <- as.data.frame(table(scmapCluster_results_fat$scmap_cluster_labs))
pred_fat <- pred_fat[order(-pred_fat$Freq),]

pred_mixt_fat <- as.data.frame(table(scmapCluster_results_fat$scmap_cluster_labs[which(colData(sce_10x)$res.0.5 %in% 12), 'sce_maca_fat']))

scmap_nr_predictions <- merge(pred_fat, pred_mixt_fat, by='Var1', suffixes=c('.total', '.mixture'))
scmap_nr_predictions
Var1 Freq.total Freq.mixture
1 epithelial cell 861 723
2 mesenchymal stem cell of adipose 43909 78
3 smooth muscle cell 749 18
4 unassigned 10852 320Interestingly, a lot of epithelial cell predictions in the mixture cluster and not that much mesenchymal stem cell predictions.
predicted_labels_fat <- as.data.frame(
    row.names=rownames(sce_10x@colData),
    x=as.vector(scmapCluster_results_fat$scmap_cluster_labs))
names(predicted_labels_fat) <- 'predicted_labels_fat'
all10x <- AddMetaData(all10x, metadata=predicted_labels_fat, col.name='predicted_labels_fat')
t1 <- TSNEPlot(all10x, group.by='predicted_labels_fat', pt.size=0.1)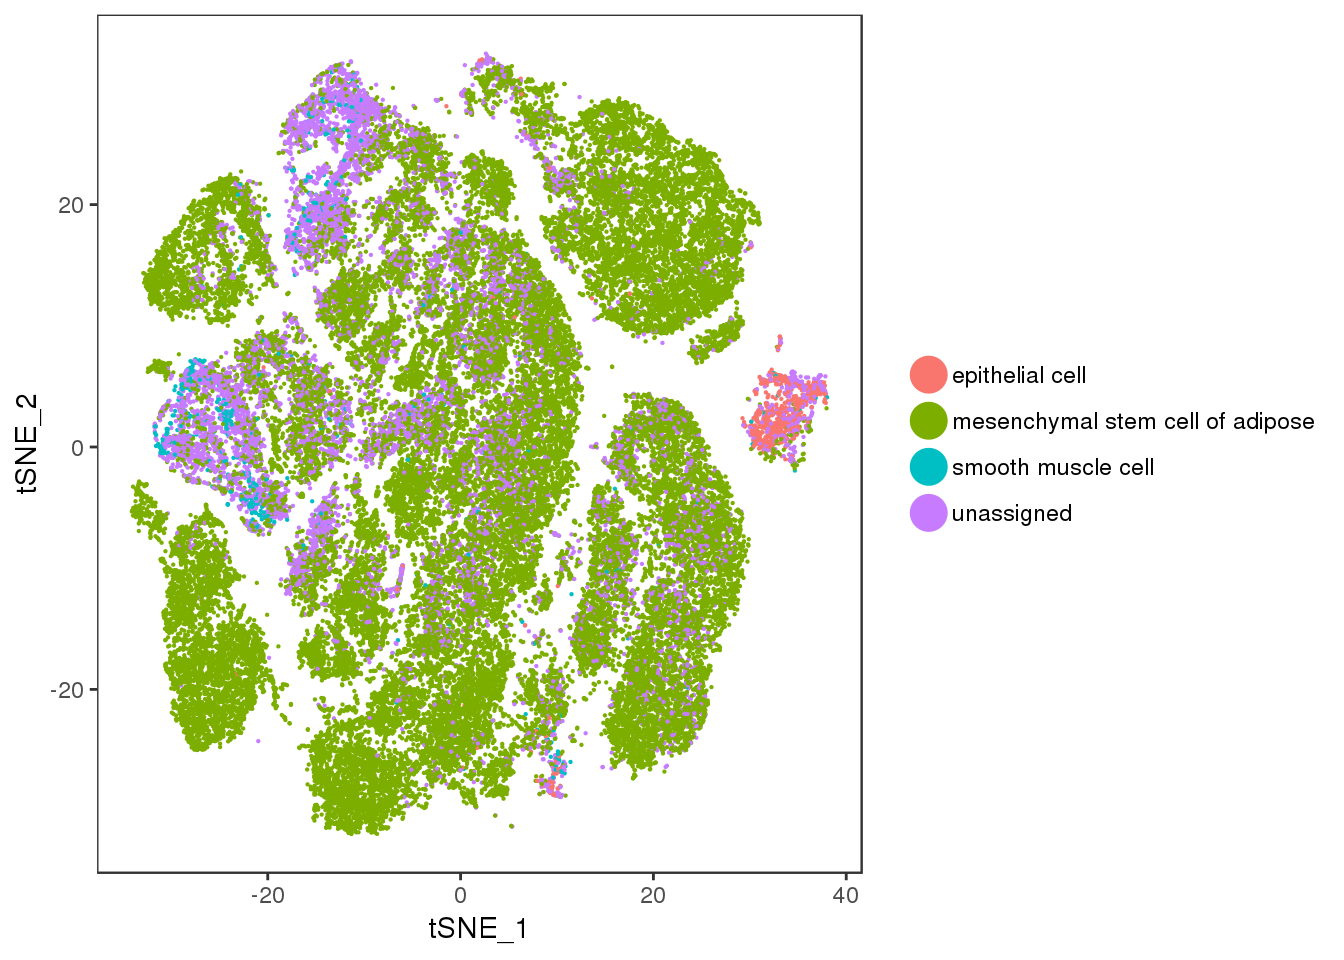
save_plot("/projects/pytrik/sc_adipose/analyze_10x_fluidigm/data/plots_slides/scmap.pdf", t1, base_width=8, base_height = 5)TSNEPlot(all10x, group.by='sample_name', pt.size=0.1, do.label=T)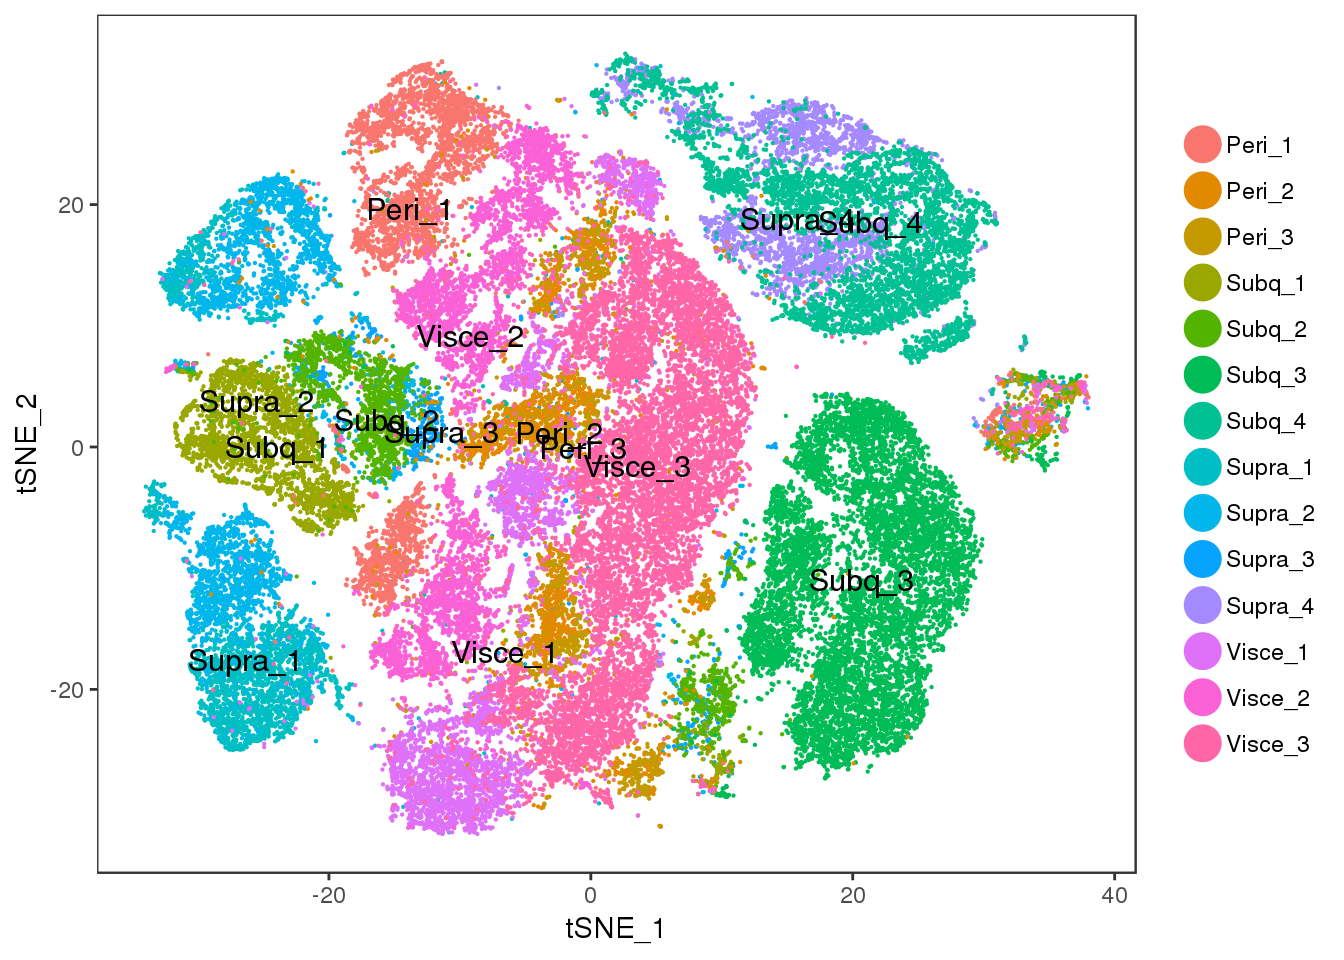
#saveRDS(all10x, 'output/10x-180504')write.table(scmap_nr_predictions, 'tables/10x-180504-scmap-numbers')Session information
sessionInfo()R version 3.4.3 (2017-11-30)
Platform: x86_64-redhat-linux-gnu (64-bit)
Running under: Storage
Matrix products: default
BLAS/LAPACK: /usr/lib64/R/lib/libRblas.so
locale:
[1] LC_CTYPE=en_US.UTF-8 LC_NUMERIC=C
[3] LC_TIME=en_US.UTF-8 LC_COLLATE=en_US.UTF-8
[5] LC_MONETARY=en_US.UTF-8 LC_MESSAGES=en_US.UTF-8
[7] LC_PAPER=en_US.UTF-8 LC_NAME=C
[9] LC_ADDRESS=C LC_TELEPHONE=C
[11] LC_MEASUREMENT=en_US.UTF-8 LC_IDENTIFICATION=C
attached base packages:
[1] parallel stats4 stats graphics grDevices utils datasets
[8] methods base
other attached packages:
[1] bindrcpp_0.2.2 dplyr_0.7.6
[3] SingleCellExperiment_1.0.0 SummarizedExperiment_1.8.1
[5] DelayedArray_0.4.1 matrixStats_0.54.0
[7] Biobase_2.38.0 GenomicRanges_1.30.3
[9] GenomeInfoDb_1.14.0 IRanges_2.12.0
[11] S4Vectors_0.16.0 BiocGenerics_0.24.0
[13] scmap_1.1.5 Seurat_2.3.4
[15] Matrix_1.2-14 cowplot_0.9.3
[17] ggplot2_3.0.0
loaded via a namespace (and not attached):
[1] Rtsne_0.13 colorspace_1.3-2 class_7.3-14
[4] modeltools_0.2-22 ggridges_0.5.0 mclust_5.4.1
[7] rprojroot_1.3-2 htmlTable_1.12 XVector_0.18.0
[10] base64enc_0.1-3 rstudioapi_0.7 proxy_0.4-22
[13] flexmix_2.3-14 bit64_0.9-7 mvtnorm_1.0-8
[16] codetools_0.2-15 splines_3.4.3 R.methodsS3_1.7.1
[19] robustbase_0.93-2 knitr_1.20 Formula_1.2-3
[22] jsonlite_1.5 workflowr_1.1.1 ica_1.0-2
[25] cluster_2.0.7-1 kernlab_0.9-27 png_0.1-7
[28] R.oo_1.22.0 compiler_3.4.3 httr_1.3.1
[31] googleVis_0.6.2 backports_1.1.2 assertthat_0.2.0
[34] lazyeval_0.2.1 lars_1.2 acepack_1.4.1
[37] htmltools_0.3.6 tools_3.4.3 igraph_1.2.2
[40] GenomeInfoDbData_1.0.0 gtable_0.2.0 glue_1.3.0
[43] RANN_2.6 reshape2_1.4.3 Rcpp_0.12.18
[46] trimcluster_0.1-2.1 gdata_2.18.0 ape_5.1
[49] nlme_3.1-137 iterators_1.0.10 fpc_2.1-11.1
[52] gbRd_0.4-11 lmtest_0.9-36 stringr_1.3.1
[55] irlba_2.3.2 gtools_3.8.1 DEoptimR_1.0-8
[58] zlibbioc_1.24.0 MASS_7.3-50 zoo_1.8-3
[61] scales_1.0.0 doSNOW_1.0.16 RColorBrewer_1.1-2
[64] yaml_2.2.0 reticulate_1.10 pbapply_1.3-4
[67] gridExtra_2.3 rpart_4.1-13 segmented_0.5-3.0
[70] latticeExtra_0.6-28 stringi_1.2.4 randomForest_4.6-14
[73] foreach_1.4.4 e1071_1.7-0 checkmate_1.8.5
[76] caTools_1.17.1.1 bibtex_0.4.2 Rdpack_0.9-0
[79] SDMTools_1.1-221 rlang_0.2.2 pkgconfig_2.0.2
[82] dtw_1.20-1 prabclus_2.2-6 bitops_1.0-6
[85] evaluate_0.11 lattice_0.20-35 ROCR_1.0-7
[88] purrr_0.2.5 bindr_0.1.1 labeling_0.3
[91] htmlwidgets_1.2 bit_1.1-14 tidyselect_0.2.4
[94] plyr_1.8.4 magrittr_1.5 R6_2.2.2
[97] snow_0.4-2 gplots_3.0.1 Hmisc_4.1-1
[100] pillar_1.3.0 whisker_0.3-2 foreign_0.8-71
[103] withr_2.1.2 fitdistrplus_1.0-9 mixtools_1.1.0
[106] RCurl_1.95-4.11 survival_2.42-6 nnet_7.3-12
[109] tsne_0.1-3 tibble_1.4.2 crayon_1.3.4
[112] hdf5r_1.0.0 KernSmooth_2.23-15 rmarkdown_1.10
[115] grid_3.4.3 data.table_1.11.4 git2r_0.23.0
[118] metap_1.0 digest_0.6.16 diptest_0.75-7
[121] tidyr_0.8.1 R.utils_2.7.0 munsell_0.5.0 This reproducible R Markdown analysis was created with workflowr 1.1.1