R Notebook
Last updated: 2019-01-02
workflowr checks: (Click a bullet for more information)-
✔ R Markdown file: up-to-date
Great! Since the R Markdown file has been committed to the Git repository, you know the exact version of the code that produced these results.
-
✔ Environment: empty
Great job! The global environment was empty. Objects defined in the global environment can affect the analysis in your R Markdown file in unknown ways. For reproduciblity it’s best to always run the code in an empty environment.
-
✔ Seed:
set.seed(20181026)The command
set.seed(20181026)was run prior to running the code in the R Markdown file. Setting a seed ensures that any results that rely on randomness, e.g. subsampling or permutations, are reproducible. -
✔ Session information: recorded
Great job! Recording the operating system, R version, and package versions is critical for reproducibility.
-
Great! You are using Git for version control. Tracking code development and connecting the code version to the results is critical for reproducibility. The version displayed above was the version of the Git repository at the time these results were generated.✔ Repository version: 9080c32
Note that you need to be careful to ensure that all relevant files for the analysis have been committed to Git prior to generating the results (you can usewflow_publishorwflow_git_commit). workflowr only checks the R Markdown file, but you know if there are other scripts or data files that it depends on. Below is the status of the Git repository when the results were generated:
Note that any generated files, e.g. HTML, png, CSS, etc., are not included in this status report because it is ok for generated content to have uncommitted changes.Ignored files: Ignored: code/.ipynb_checkpoints/ Ignored: output/10x-180504 Ignored: output/10x-180504-aligned Ignored: output/10x-180504-aligned-metageneplot Ignored: output/10x-180504-beforeQC Ignored: output/10x-180504-beforeqc Ignored: output/10x-180504-cca-discardedcells Ignored: output/10x-180504-ccregout Ignored: output/10x-180504-ccregout-aligned Ignored: output/10x-180504-ccregout-cca-discardedcells Ignored: output/10x-180831 Ignored: output/10x-180831-T1T2T3 Ignored: output/10x-180831-T4T5 Ignored: output/10x-180831-beforeqc Ignored: output/10x-180831-notcleaned Ignored: output/monocle/ Untracked files: Untracked: analysis/.ipynb_checkpoints/velocyto_notebook_180831-checkpoint.ipynb Untracked: analysis/velocyto_notebook_180831.ipynb Untracked: output/velocyto/10x-180831.hdf5 Untracked: output/velocyto/10x-180831.loom Untracked: tables/10x-180831-metadata.txt Untracked: tables/BEAM_GSEA/ Unstaged changes: Deleted: analysis/.ipynb_checkpoints/velocyto_notebook_180504-Copy1-checkpoint.ipynb Modified: analysis/10x-180504-general-analysis.Rmd Deleted: analysis/velocyto_notebook_180504-Copy1.ipynb Modified: code/velocyto_preprocess.py Modified: code/velocyto_workflow.py Modified: plots/180504_pca_tsne.pdf Modified: plots/supplementary_figures/sfig_180504_pcelbow.pdf Modified: plots/supplementary_figures/sfig_180504_qcplots.pdf
Expand here to see past versions:
| File | Version | Author | Date | Message |
|---|---|---|---|---|
| Rmd | 9080c32 | PytrikFolkertsma | 2019-01-02 | wflow_publish(c(“analysis/10x-180831-general-analysis.Rmd”)) |
| Rmd | 603cd15 | PytrikFolkertsma | 2019-01-01 | updates |
| html | 387bfa6 | PytrikFolkertsma | 2018-11-11 | Build site. |
| Rmd | dc4a8ca | PytrikFolkertsma | 2018-11-11 | wflow_publish(c(“analysis/10x-180831-general-analysis.Rmd”)) |
library(Seurat)Loading required package: ggplot2Loading required package: cowplot
Attaching package: 'cowplot'The following object is masked from 'package:ggplot2':
ggsaveLoading required package: Matrixlibrary(dplyr)
Attaching package: 'dplyr'The following objects are masked from 'package:stats':
filter, lagThe following objects are masked from 'package:base':
intersect, setdiff, setequal, unionseurobj <- readRDS('output/10x-180831')Quality control plots
The number of genes expressed descreases over time.
VlnPlot(seurobj, c("nGene", "percent.mito", "nUMI"), group.by='timepoint', nCol = 1, point.size.use=-1, size.x.use = 10)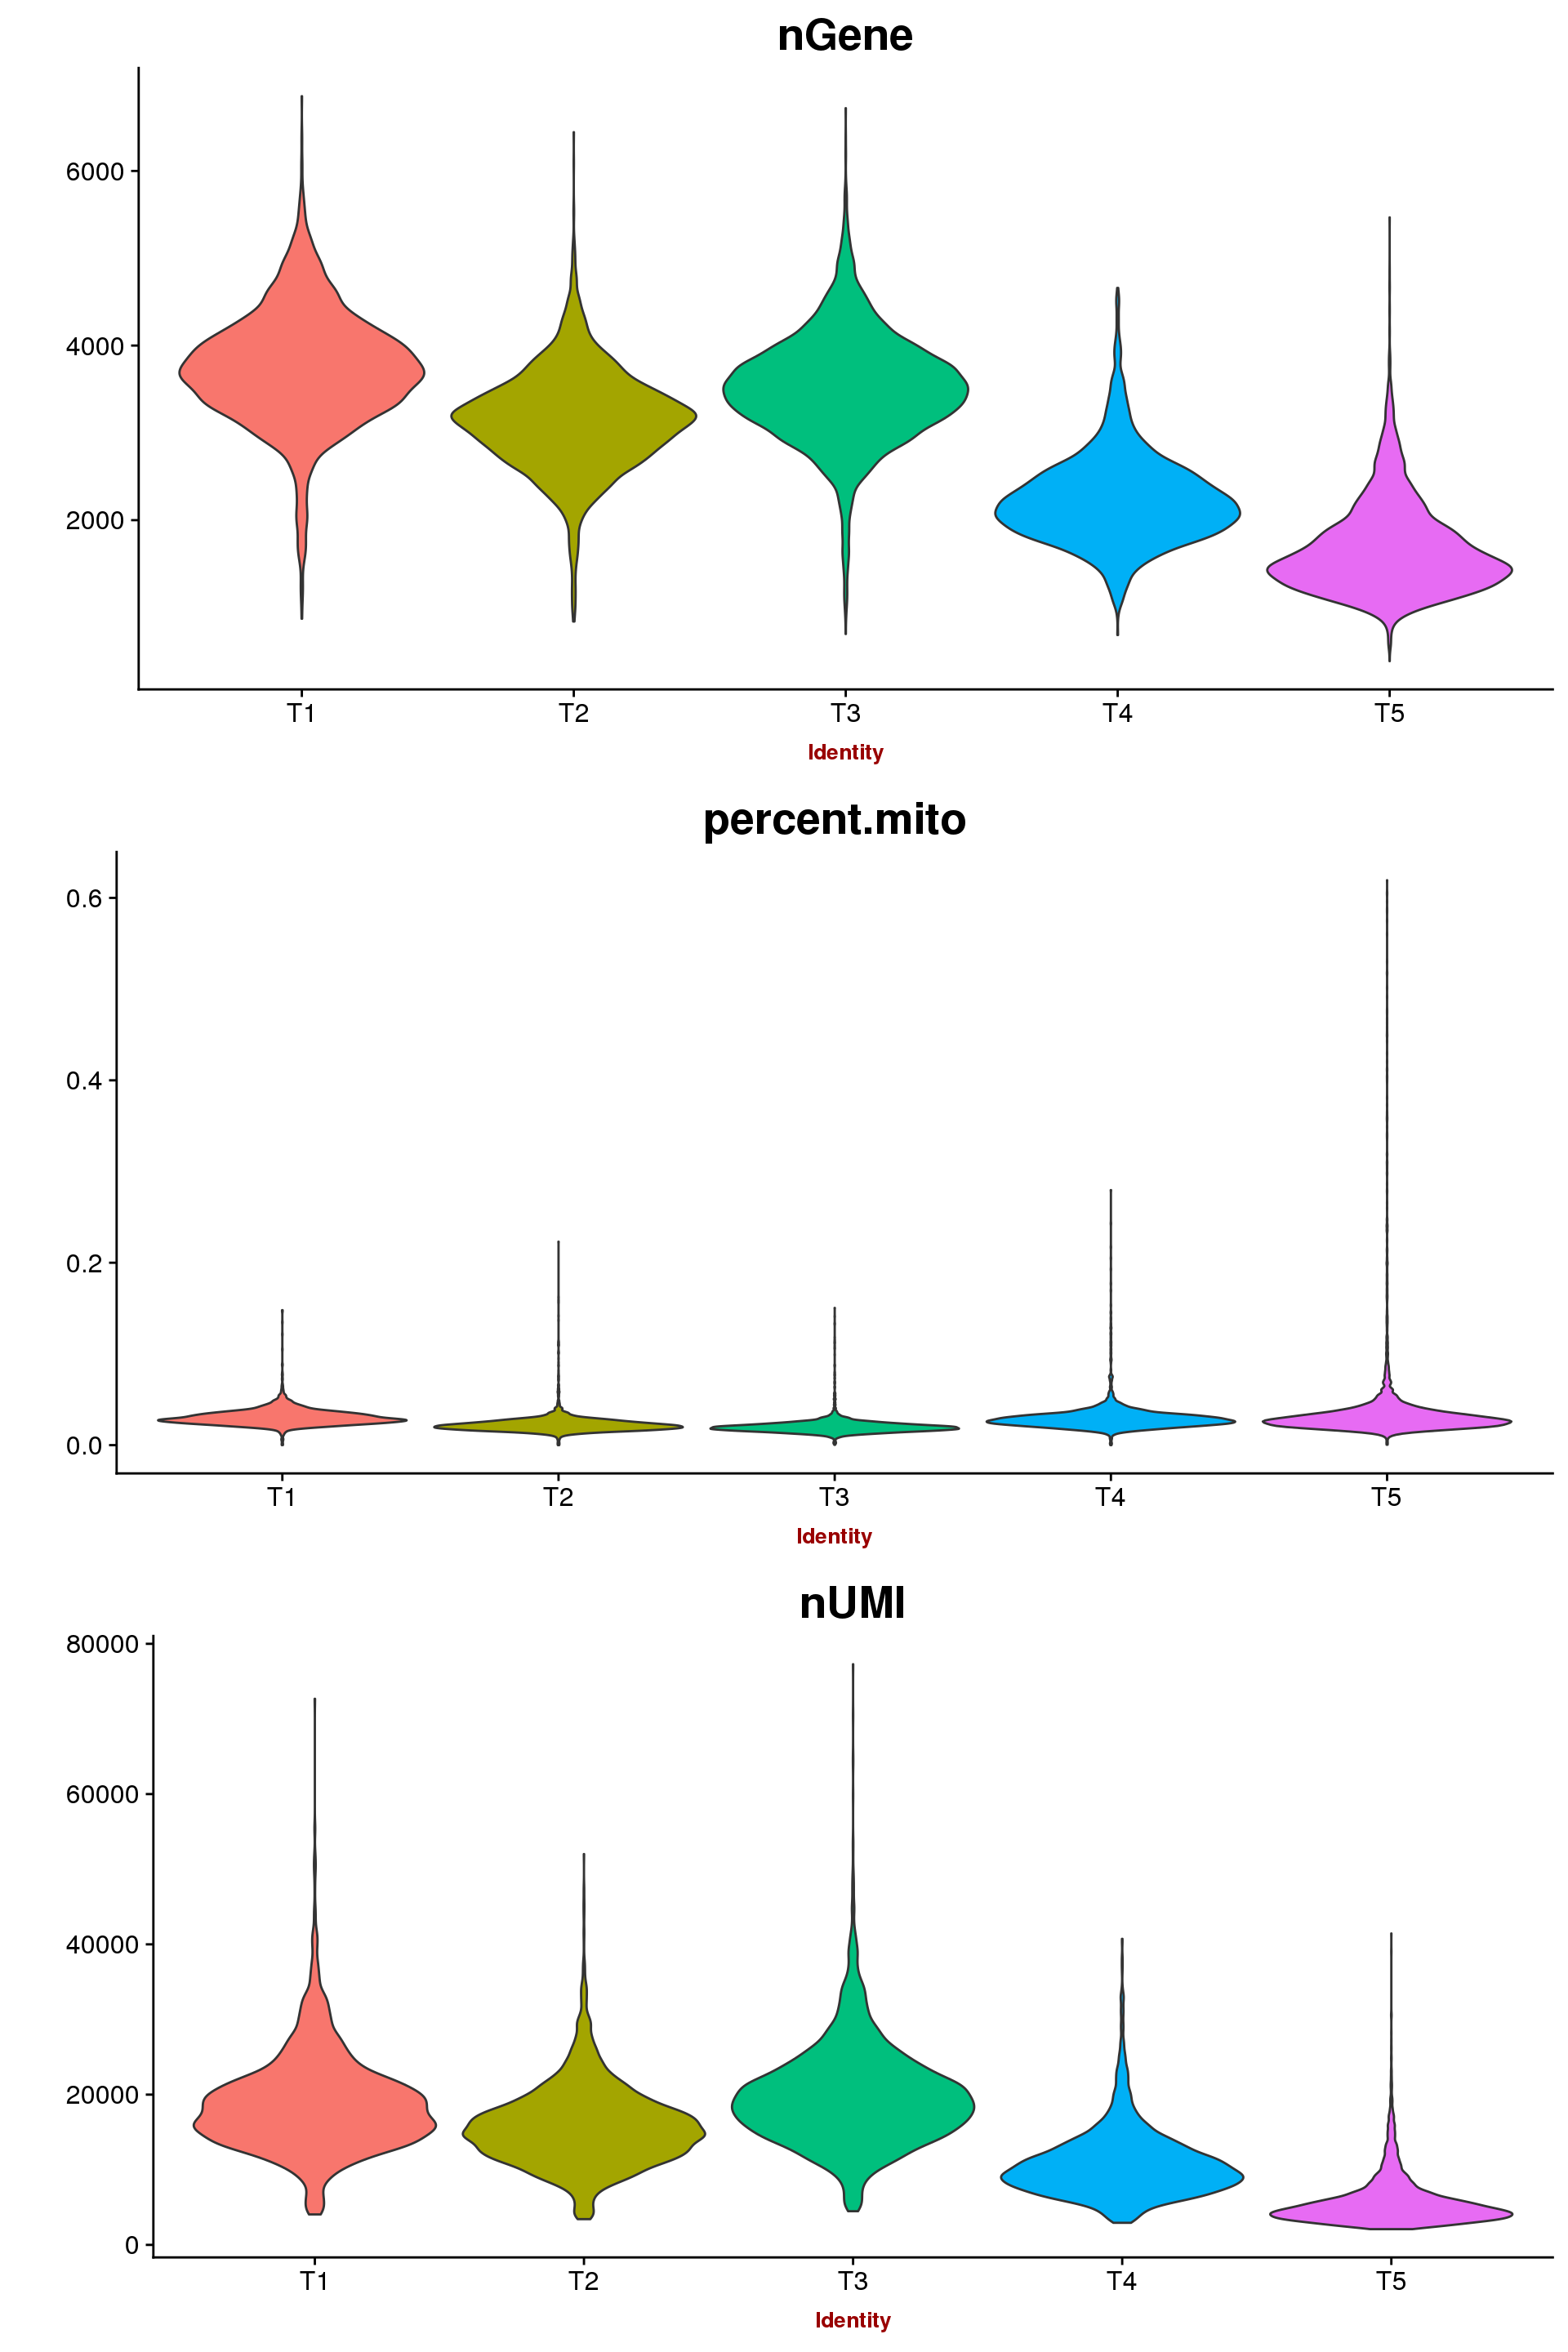
Expand here to see past versions of fig1-1.png:
| Version | Author | Date |
|---|---|---|
| 387bfa6 | PytrikFolkertsma | 2018-11-11 |
GenePlot(seurobj, 'nUMI', 'nGene', cex.use = 0.5)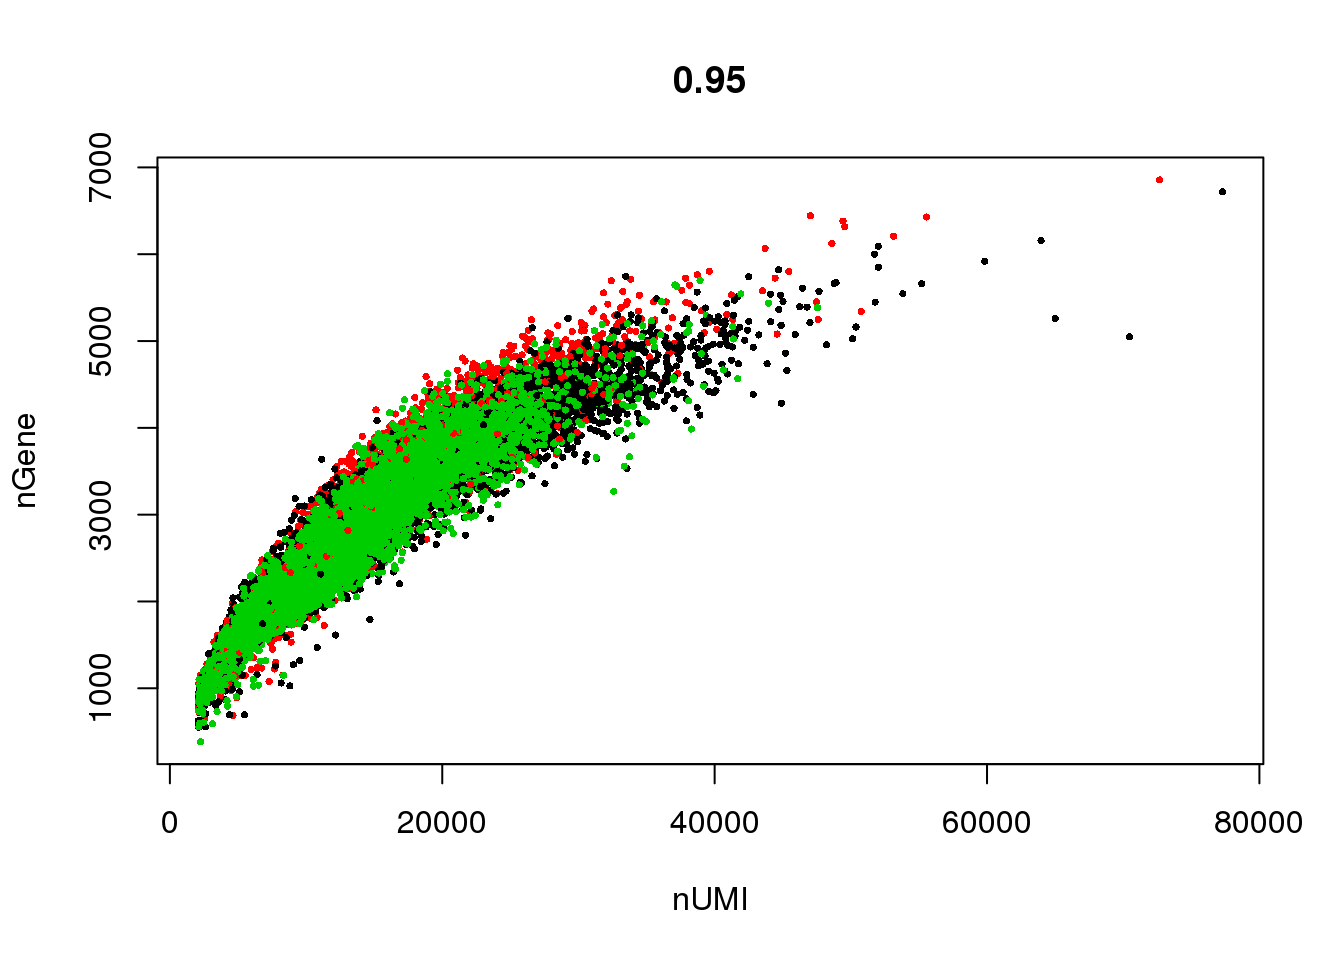
Expand here to see past versions of unnamed-chunk-2-1.png:
| Version | Author | Date |
|---|---|---|
| 387bfa6 | PytrikFolkertsma | 2018-11-11 |
PCElbowPlot(seurobj, num.pc=50) #TSNE+clustering run on 21 PC's.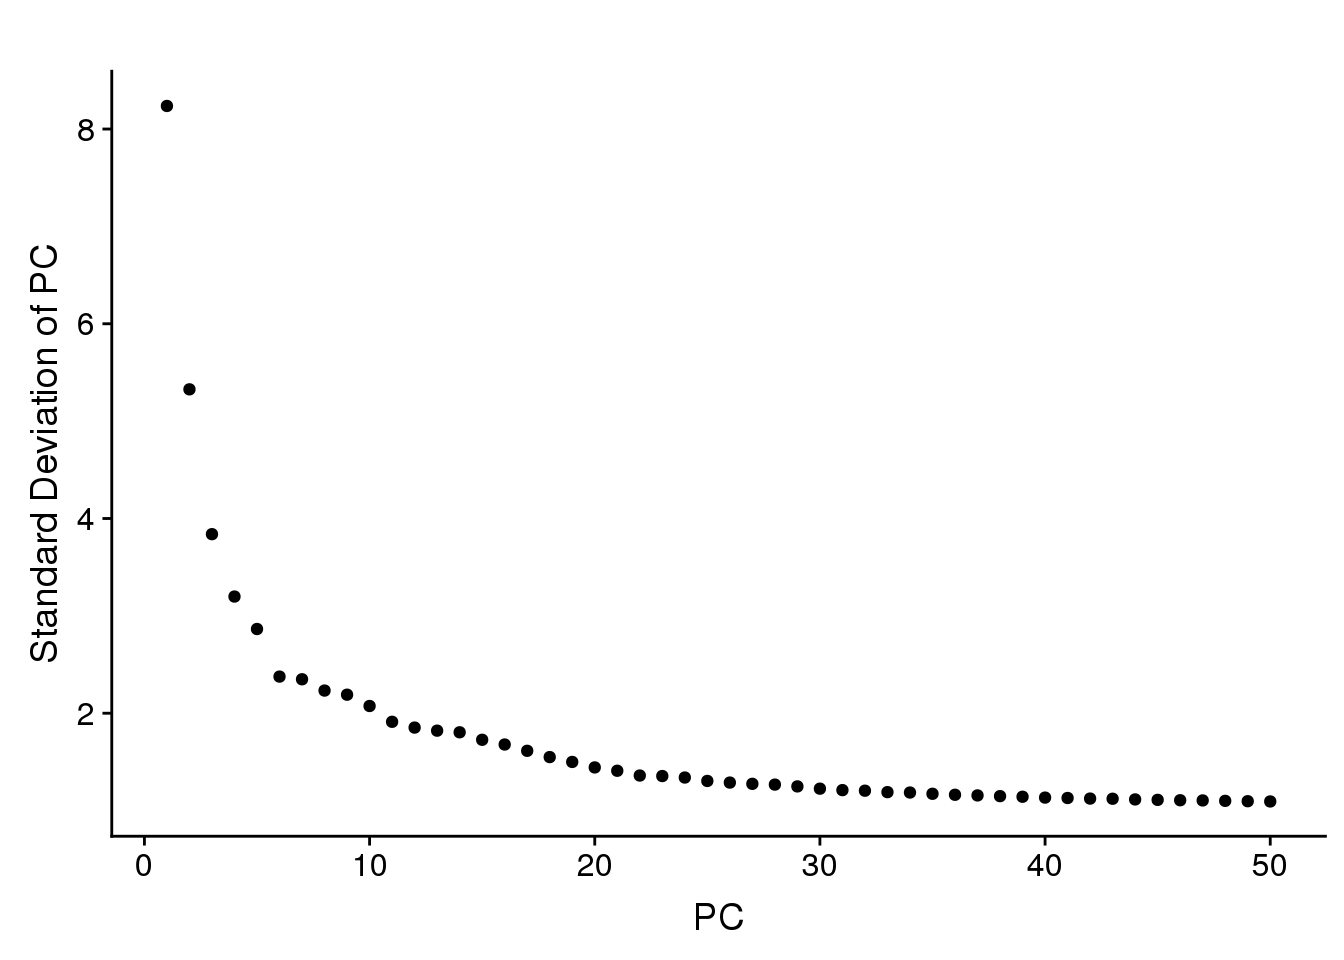
Expand here to see past versions of unnamed-chunk-3-1.png:
| Version | Author | Date |
|---|---|---|
| 387bfa6 | PytrikFolkertsma | 2018-11-11 |
PCA
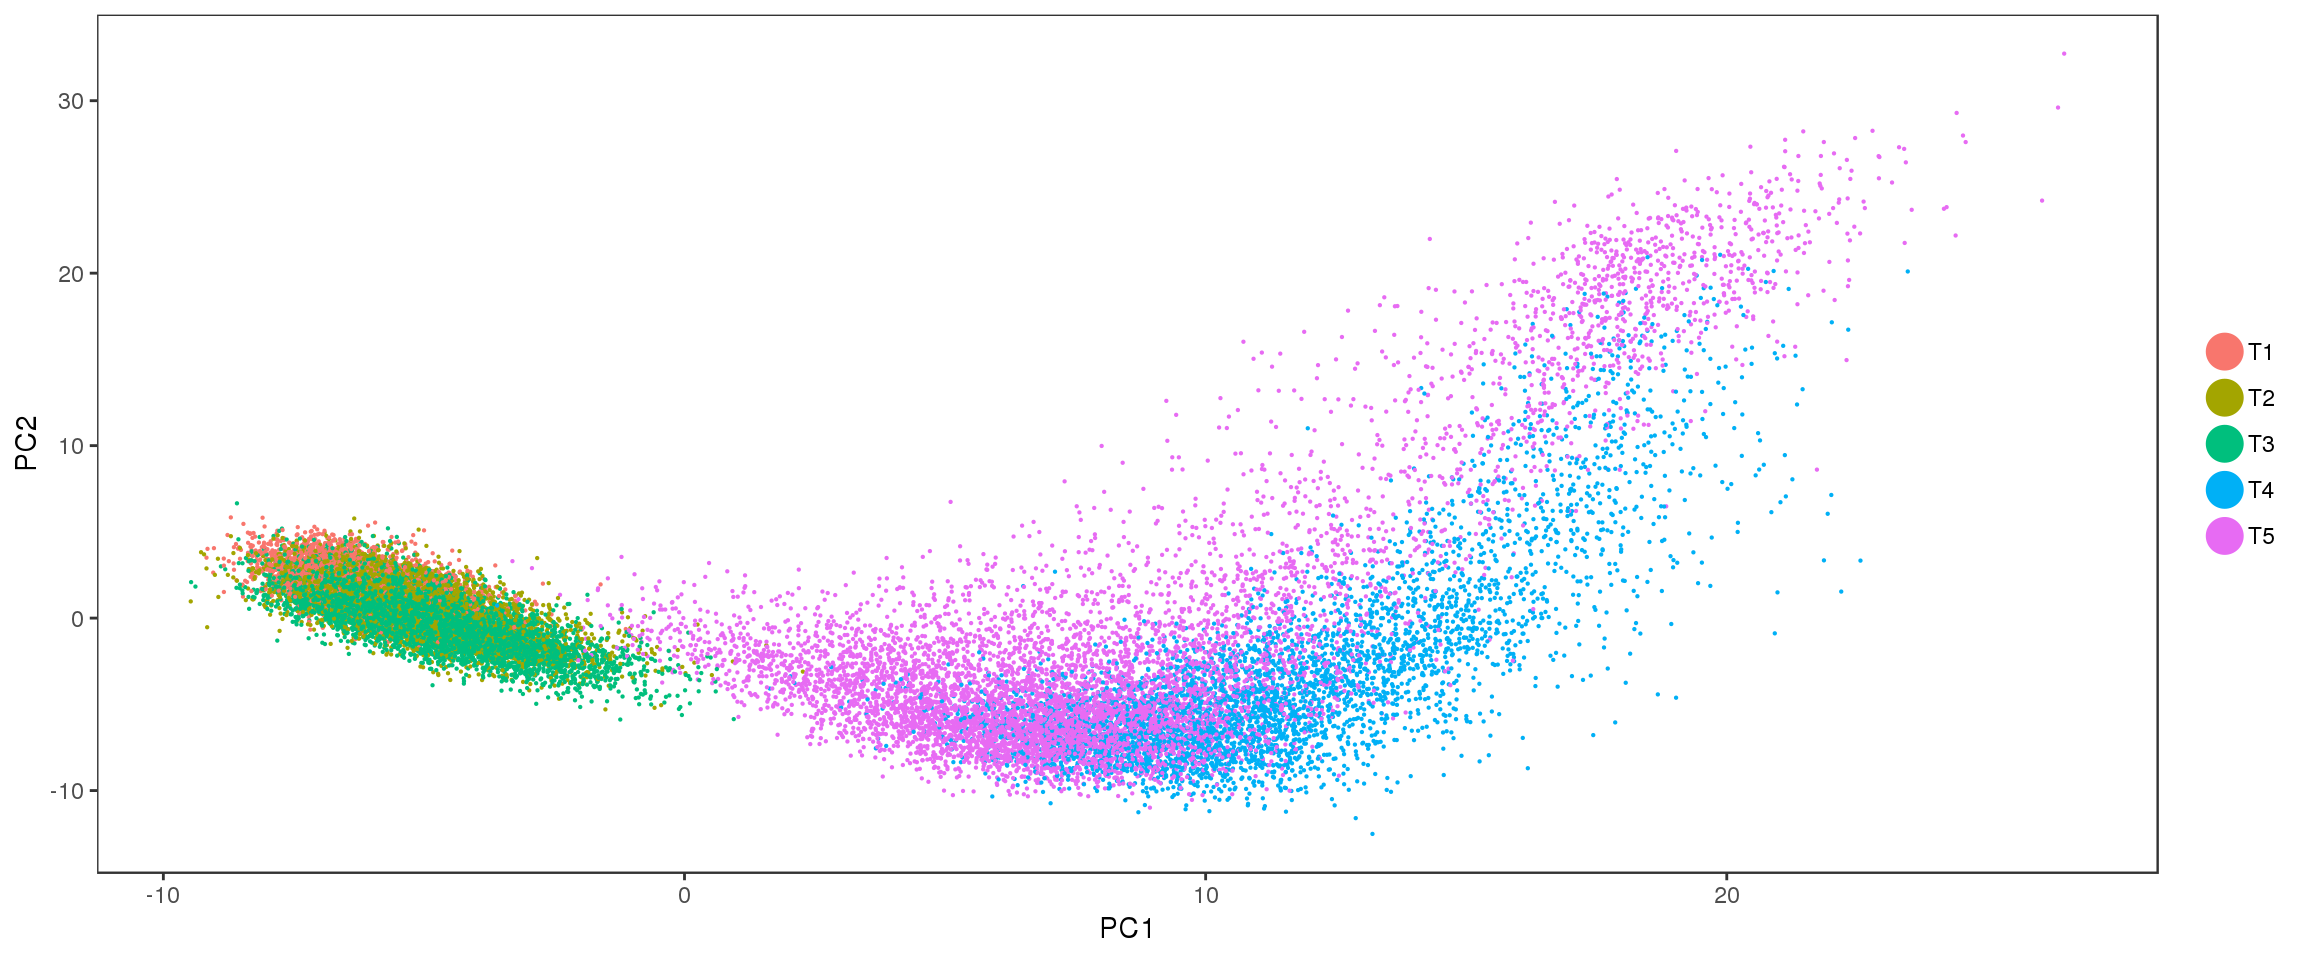
Interesting to see: T4 and T5 contain a lot more variation than T1, T2 and T3, and PC2 seems to split T4 and T5. Could the split in PC2 describe the cells developing into white or brown?
PCAPlot(seurobj, group.by='timepoint', pt.size=0.1)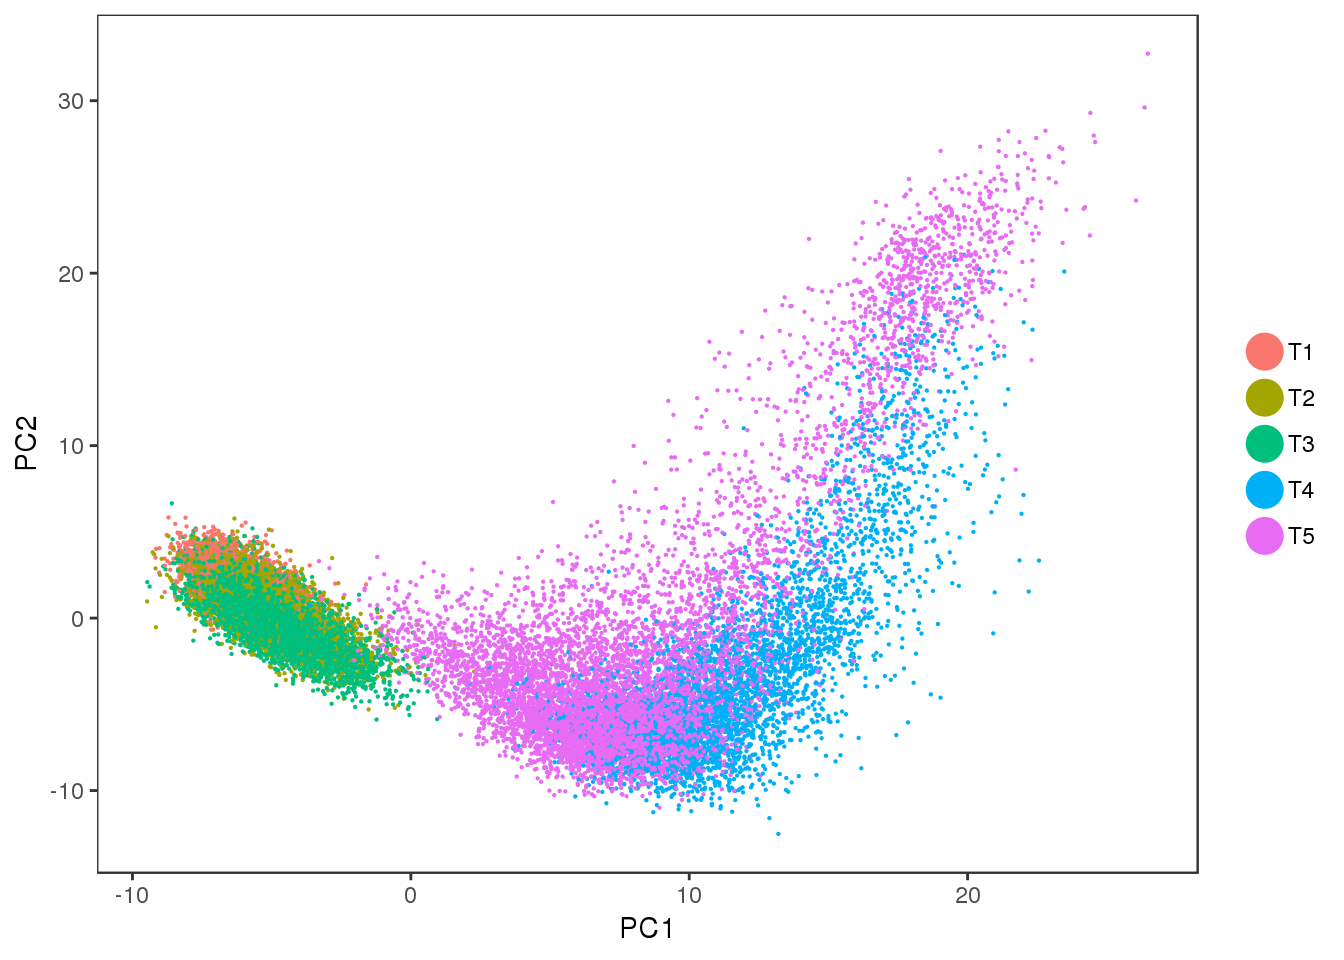
Expand here to see past versions of unnamed-chunk-4-1.png:
| Version | Author | Date |
|---|---|---|
| 387bfa6 | PytrikFolkertsma | 2018-11-11 |
A few clusters in the data have much higher expression of ‘ADIPOQ’, ‘SCD’, ‘RBP4’, ‘G0S2’, ‘PLIN4’, ‘FABP5’. This seems to be captured by PC2.
FeaturePlot(seurobj, reduction.use='pca', features.plot=c('ADIPOQ', 'SCD', 'RBP4', 'G0S2', 'PLIN4', 'FABP5'), pt.size=1, cols.use=c('gray', 'blue'), no.legend=F, nCol=2)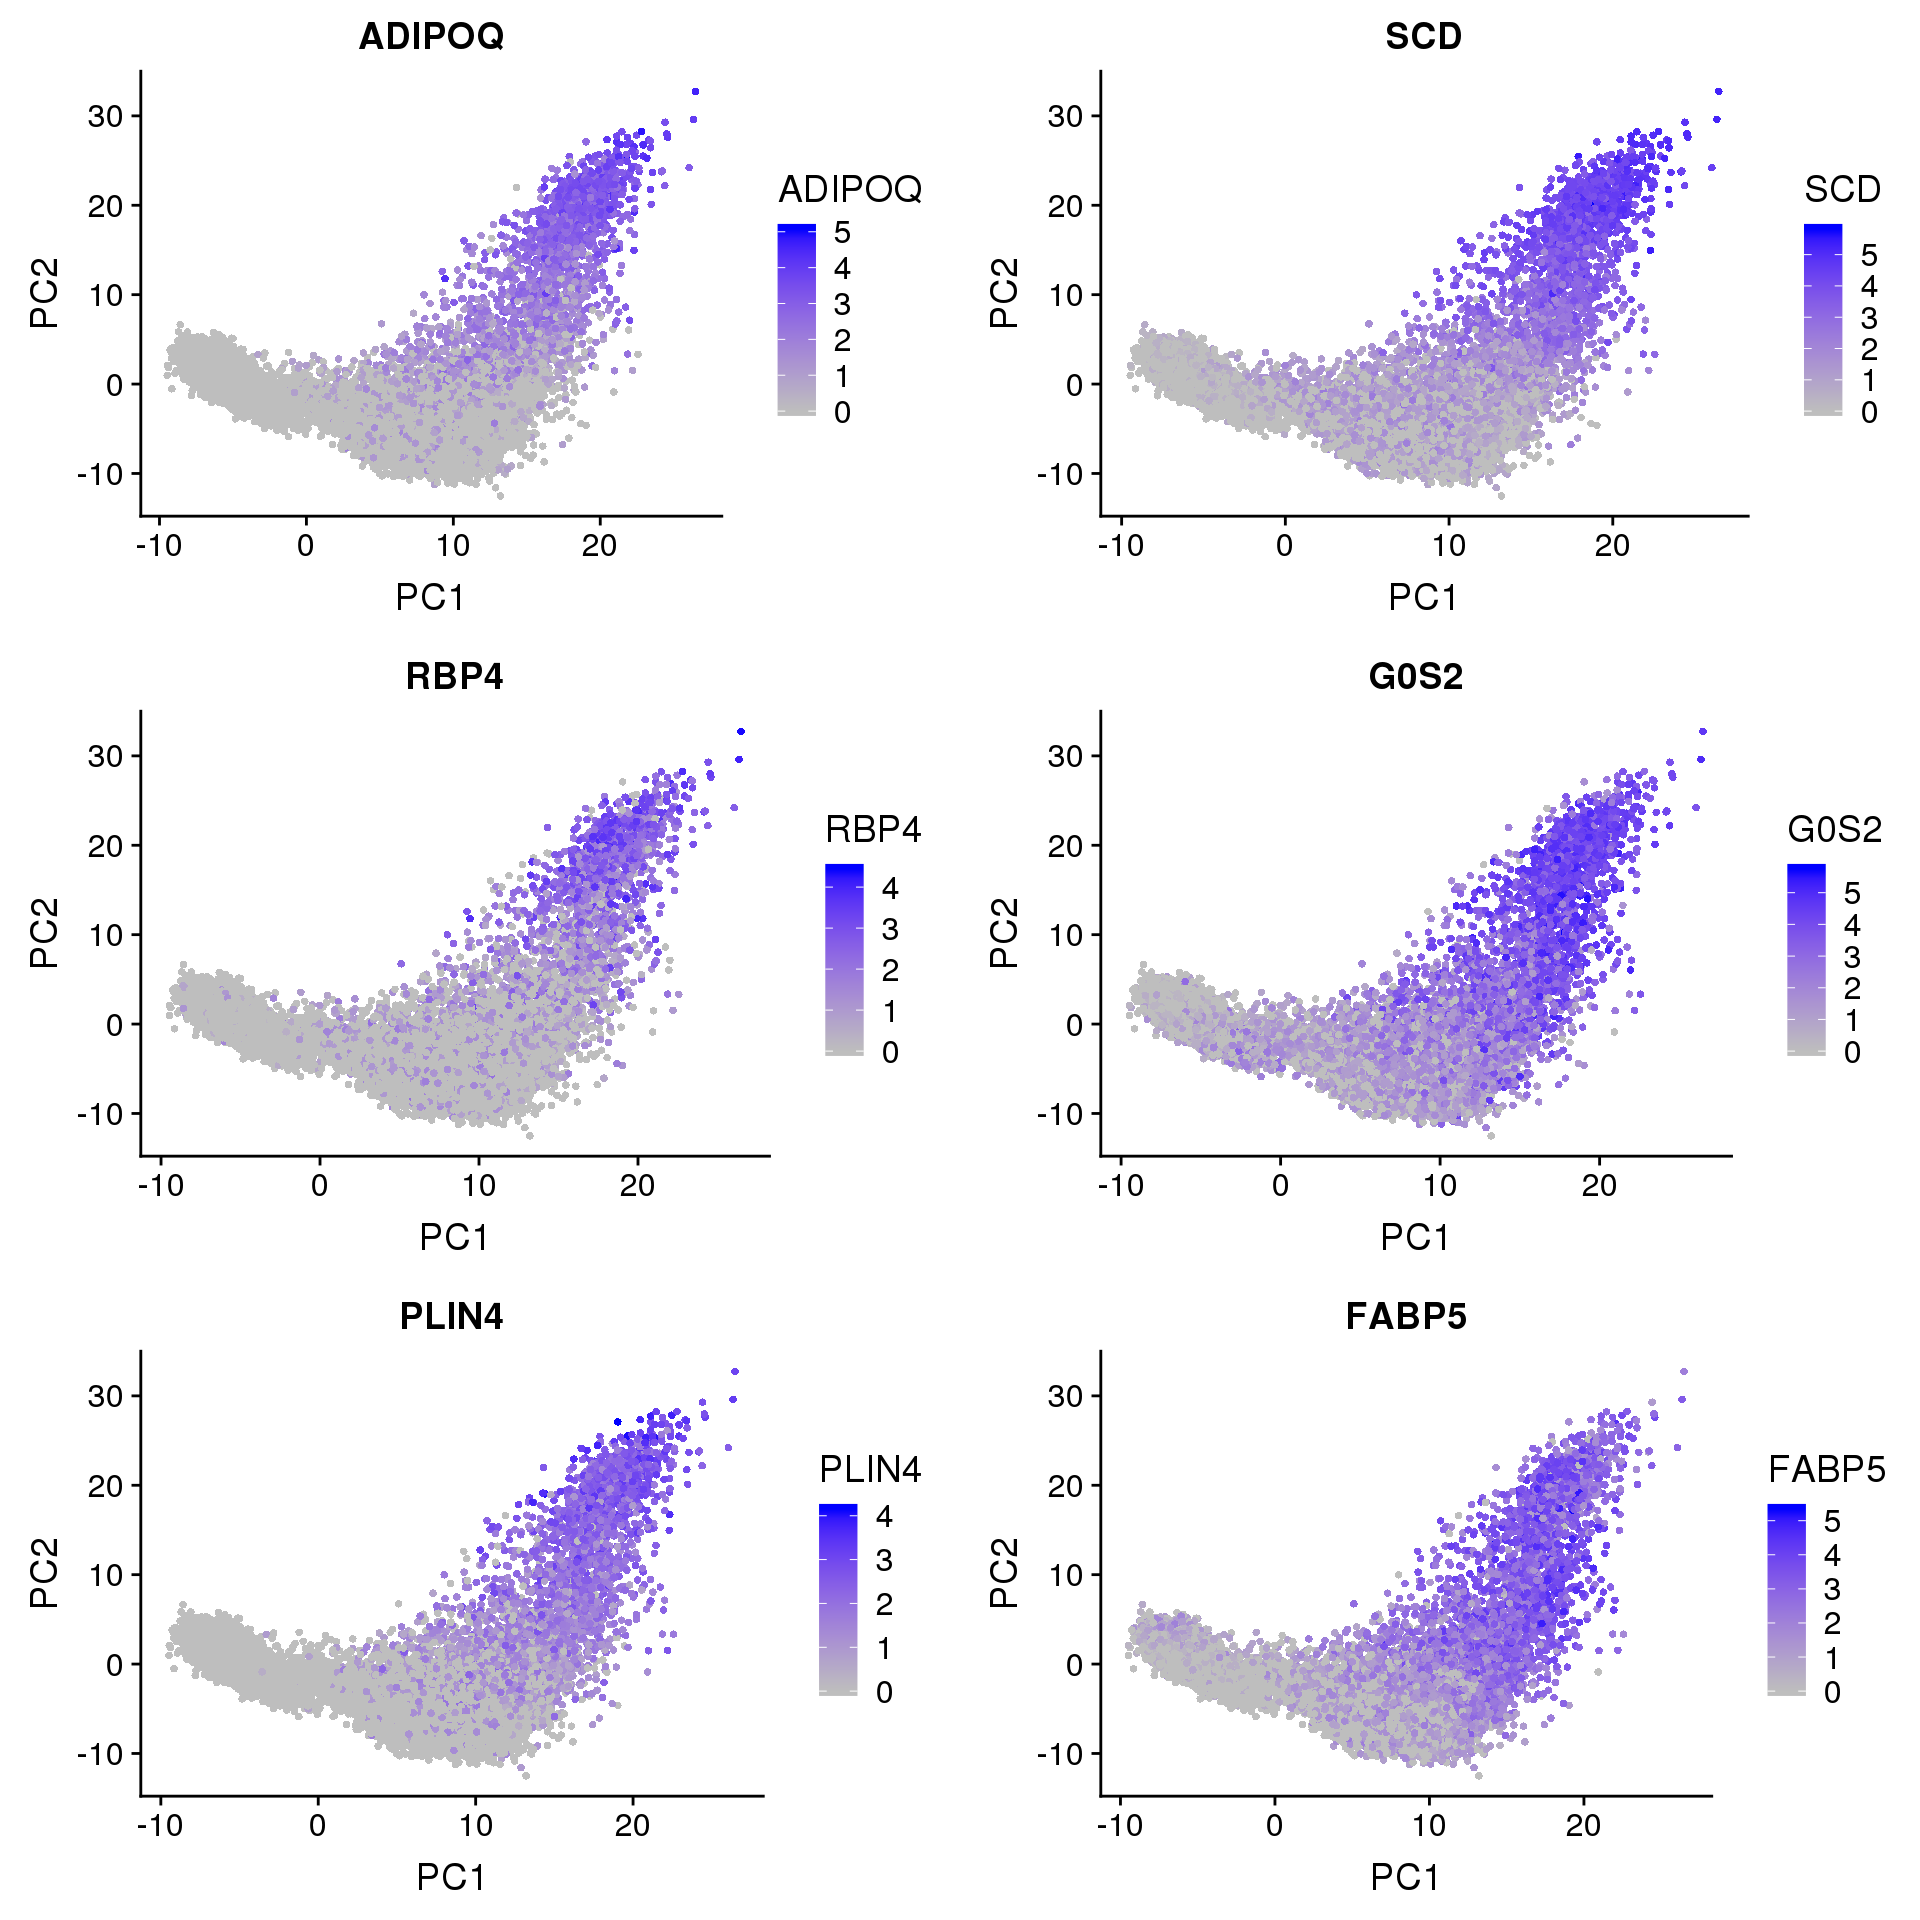
Expand here to see past versions of fig2-1.png:
| Version | Author | Date |
|---|---|---|
| 387bfa6 | PytrikFolkertsma | 2018-11-11 |
FeaturePlot(seurobj, reduction.use='pca', features.plot=c('PLA2G2A', 'MT1X', 'APOD', 'DPT', 'PTGDS', 'IGF2'), pt.size=1, cols.use=c('gray', 'blue'), no.legend=F, nCol=2)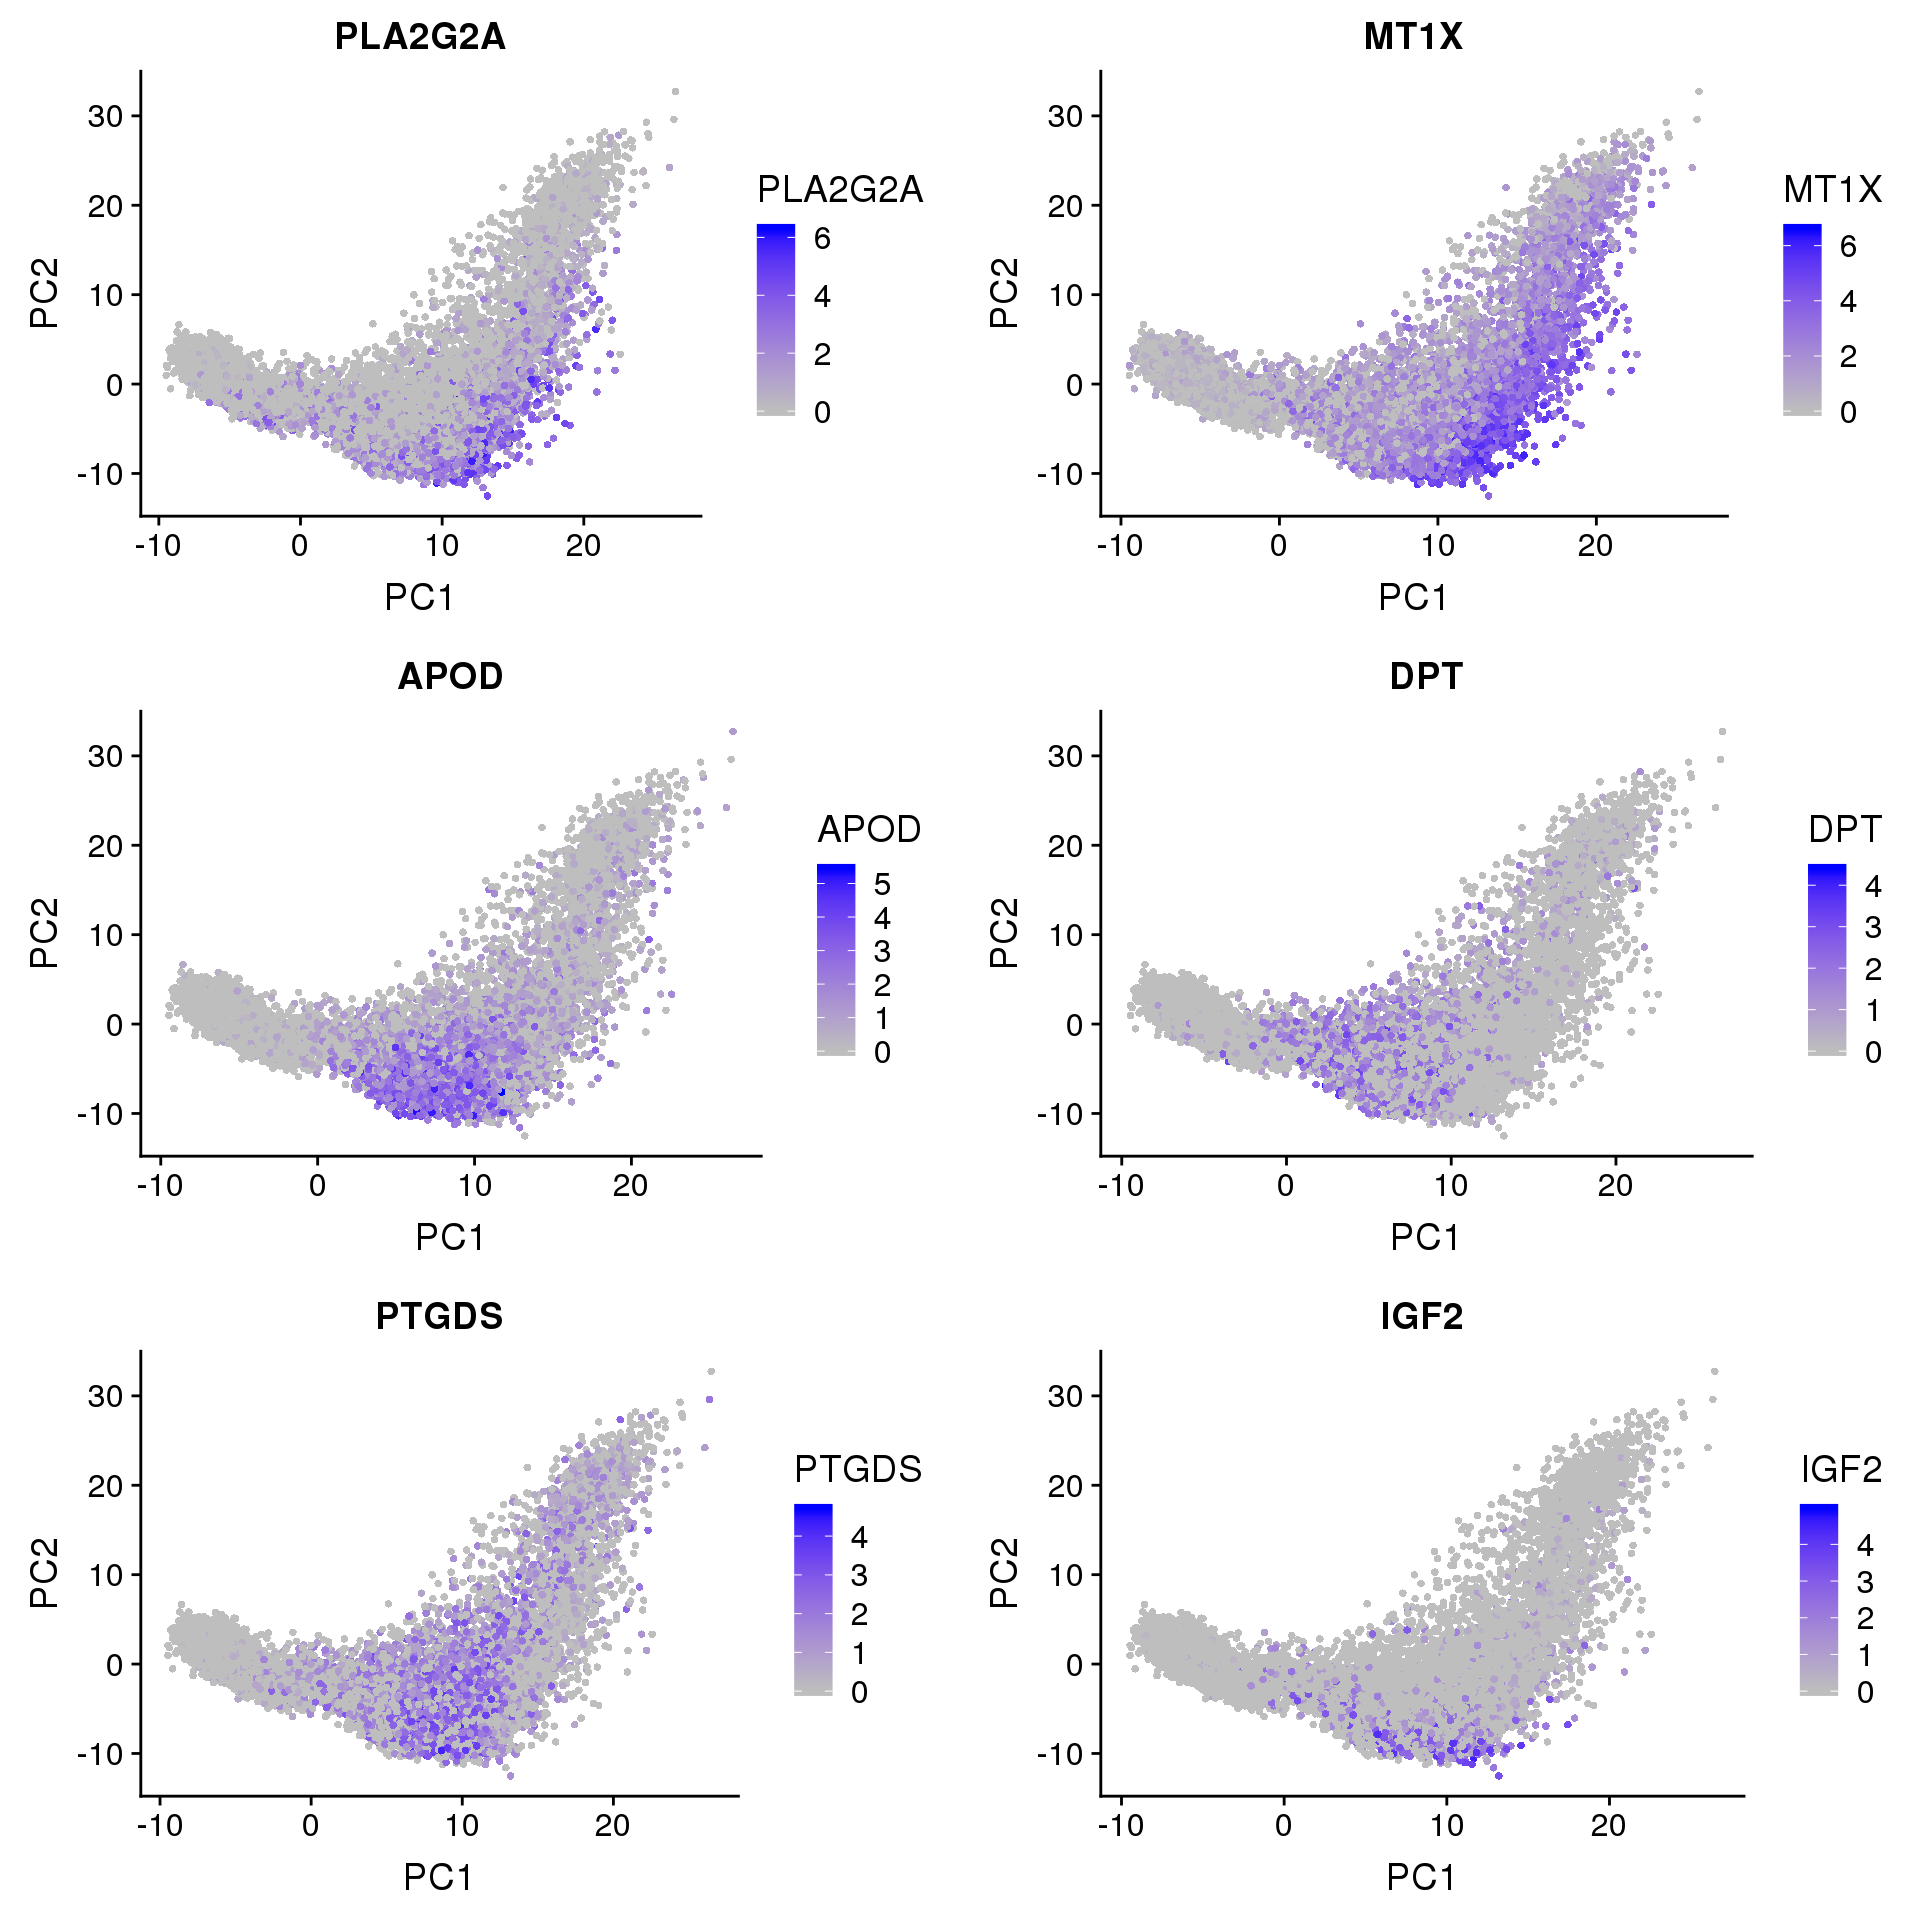
Expand here to see past versions of fig3-1.png:
| Version | Author | Date |
|---|---|---|
| 387bfa6 | PytrikFolkertsma | 2018-11-11 |
PLA2G2A: http://www.jlr.org/content/early/2017/06/29/jlr.M076141 “…suggesting that PLA2G2A activates mitochondrial uncoupling in brown adipose tissue.”
PDGFRα/PDGFRβ signaling balance modulates progenitor cell differentiation into white and beige adipocytes. Based on PDGFRα or PDGFRβ deletion and ectopic expression experiments, we conclude that the PDGFRα/PDGFRβ signaling balance determines progenitor commitment to beige (PDGFRα) or white (PDGFRβ) adipogenesis. Our study suggests that adipocyte lineage specification and metabolism can be modulated through PDGFR signaling. http://dev.biologists.org/content/145/1/dev155861.long
FeaturePlot(seurobj, reduction.use='pca', features.plot=c('PDGFRA', 'PDGFRB'), pt.size=1, cols.use=c('gray', 'blue'), no.legend=F, nCol=2)
Expand here to see past versions of fig4-1.png:
| Version | Author | Date |
|---|---|---|
| 387bfa6 | PytrikFolkertsma | 2018-11-11 |
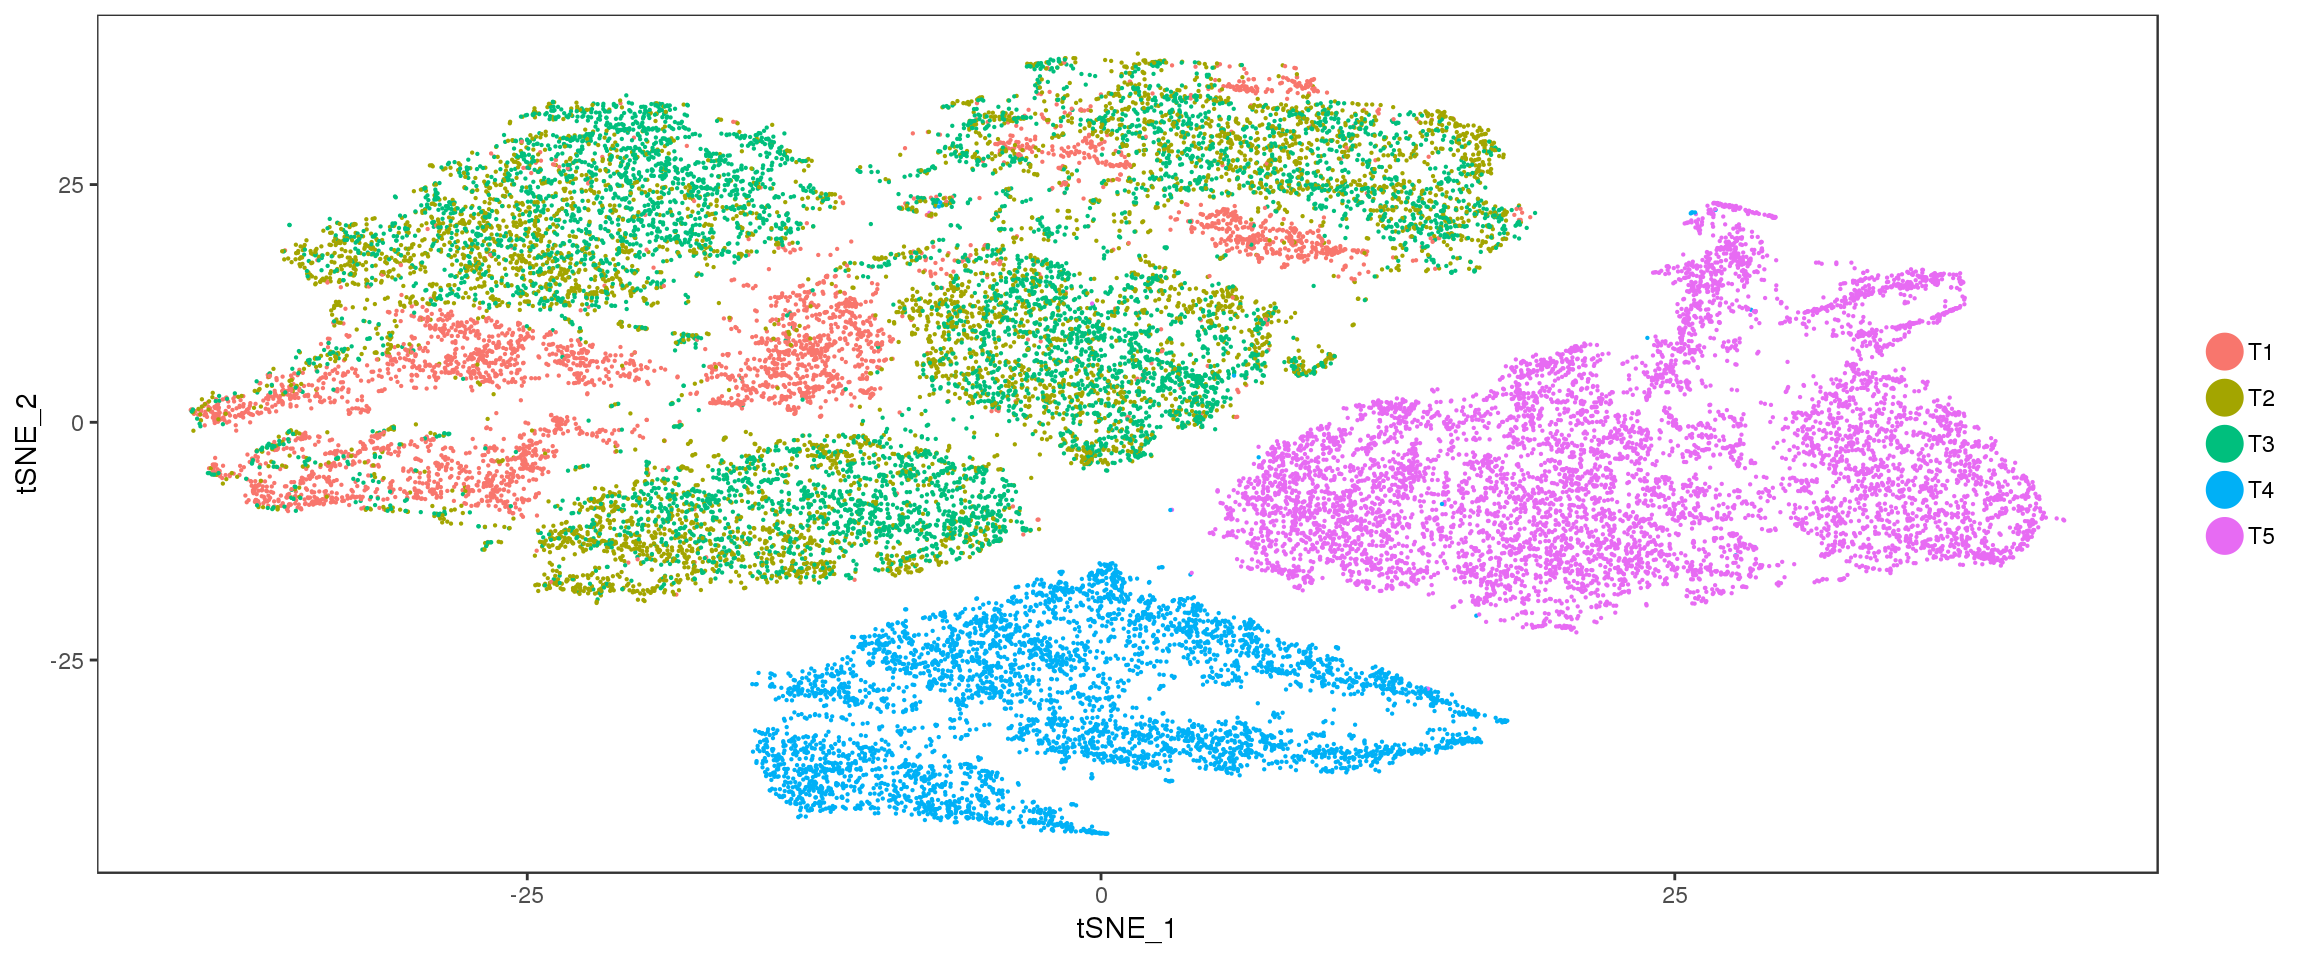
TSNE
TSNEPlot(seurobj, group.by='timepoint', pt.size=0.1)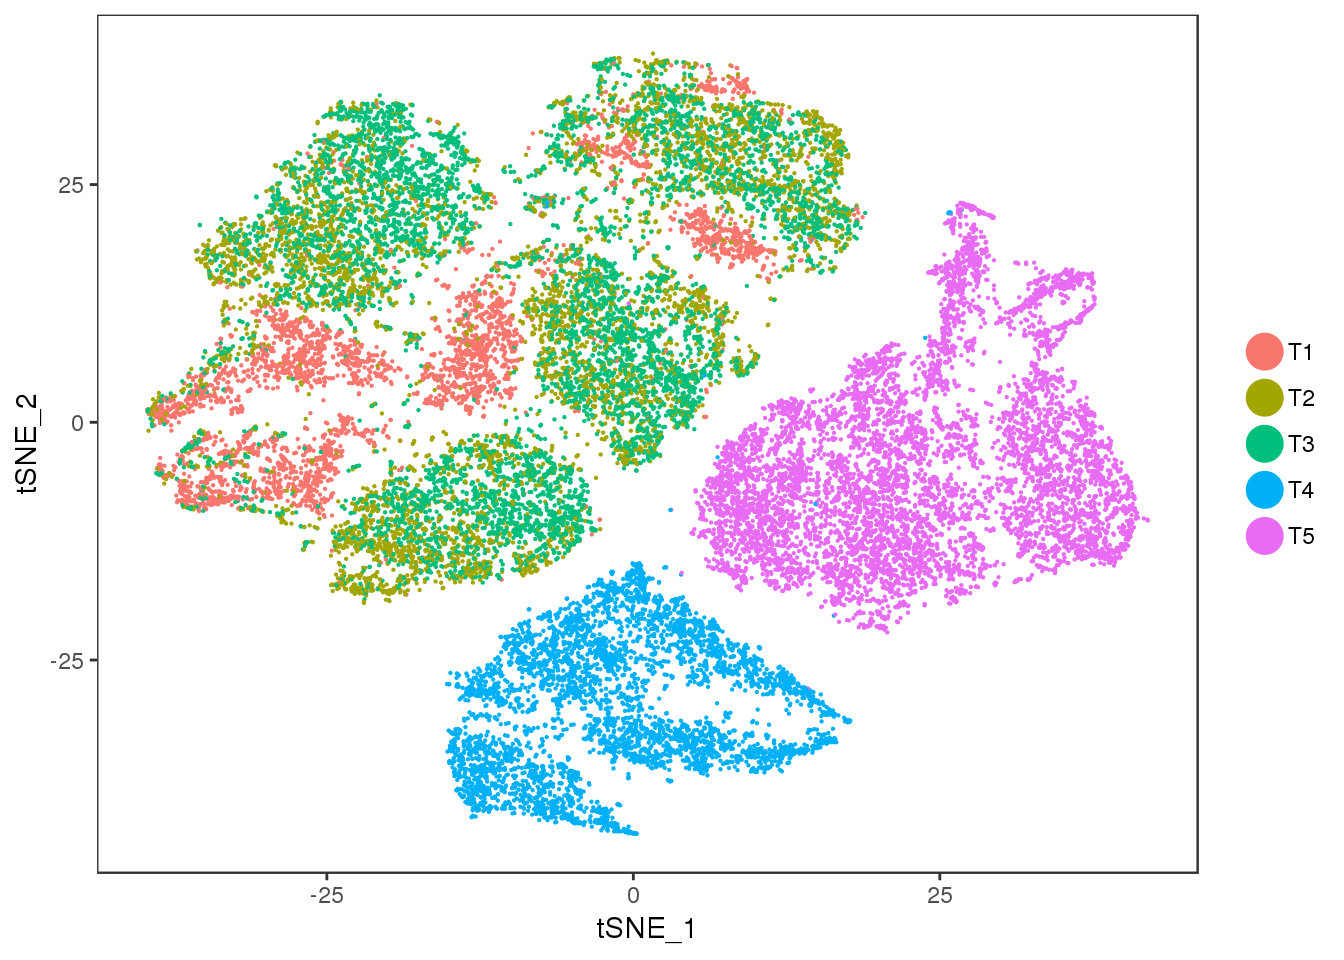
Expand here to see past versions of unnamed-chunk-5-1.png:
| Version | Author | Date |
|---|---|---|
| 387bfa6 | PytrikFolkertsma | 2018-11-11 |
TSNEPlot(seurobj, group.by='Phase', pt.size=0.1)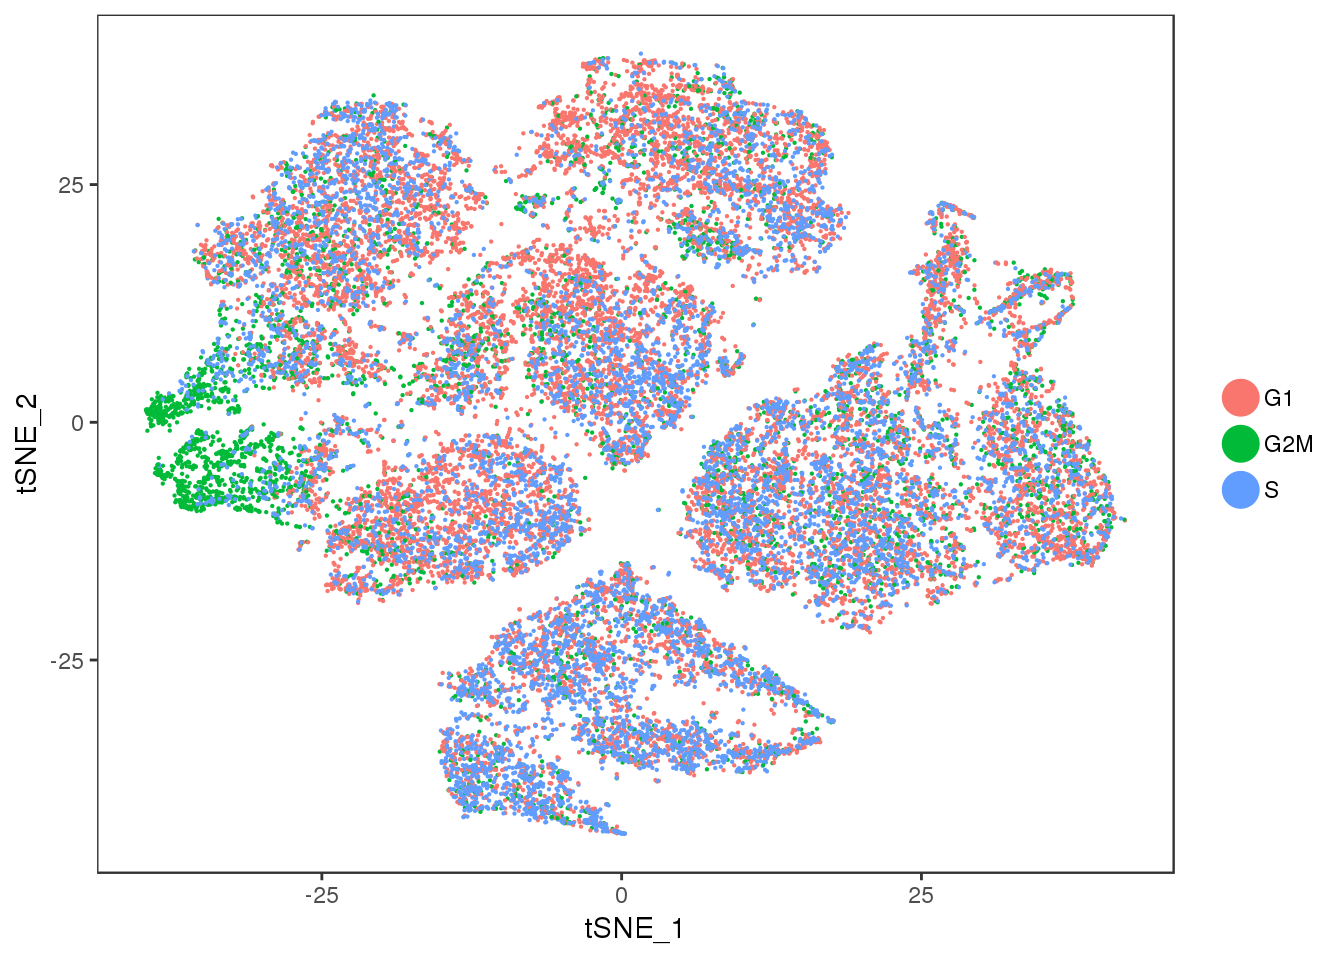
Expand here to see past versions of unnamed-chunk-6-1.png:
| Version | Author | Date |
|---|---|---|
| 387bfa6 | PytrikFolkertsma | 2018-11-11 |
Cluster 11 = mixture cluster.
TSNEPlot(seurobj, group.by='res.0.5', pt.size=0.1, do.label=T)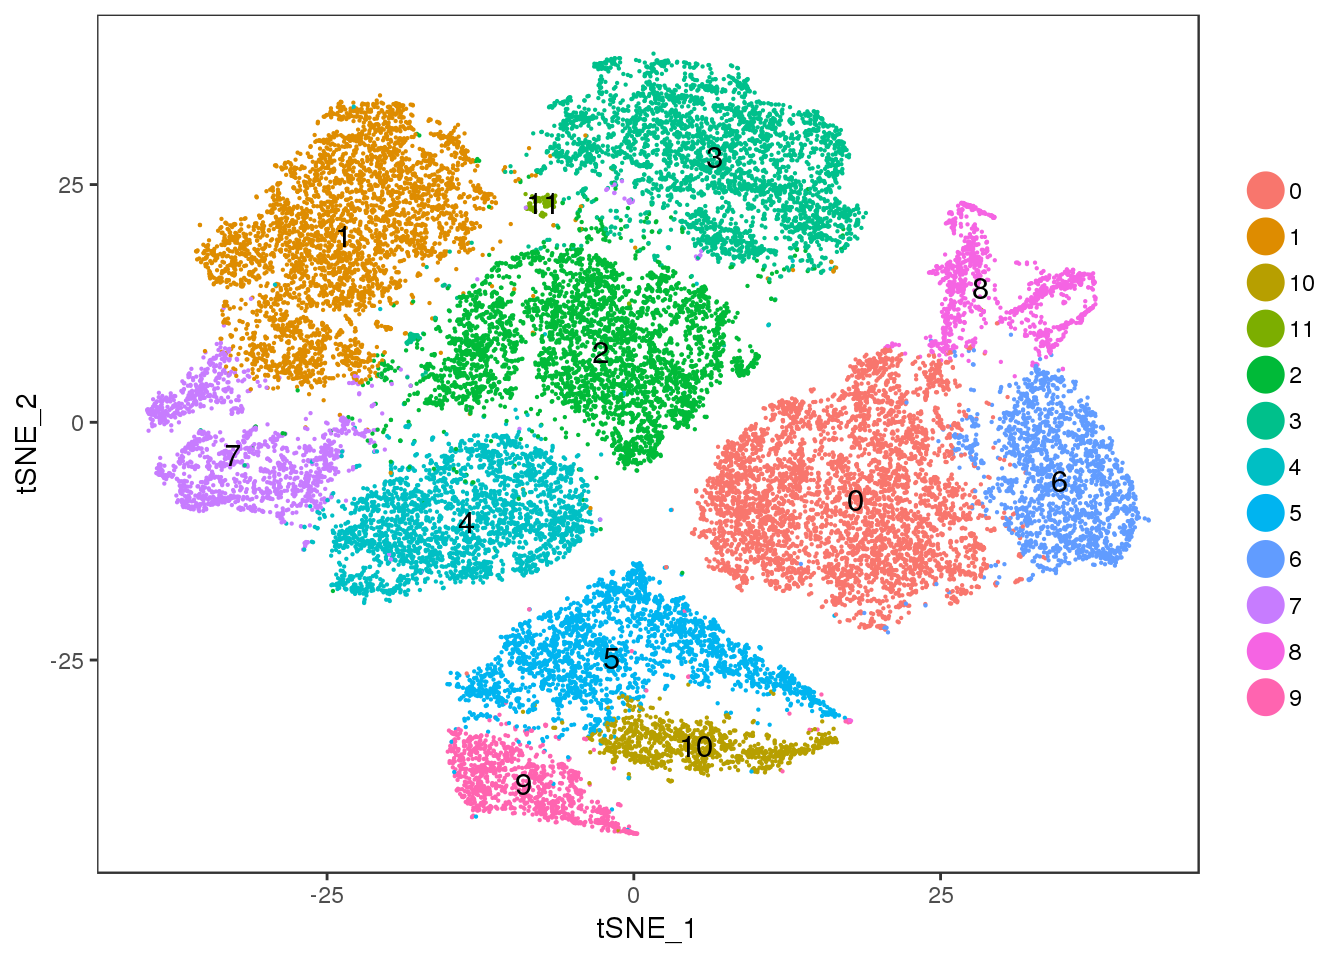
Expand here to see past versions of unnamed-chunk-7-1.png:
| Version | Author | Date |
|---|---|---|
| 387bfa6 | PytrikFolkertsma | 2018-11-11 |
VlnPlot(seurobj, group.by='res.0.5', features.plot=c('MALAT1', 'NEAT1'), point.size.use=-1)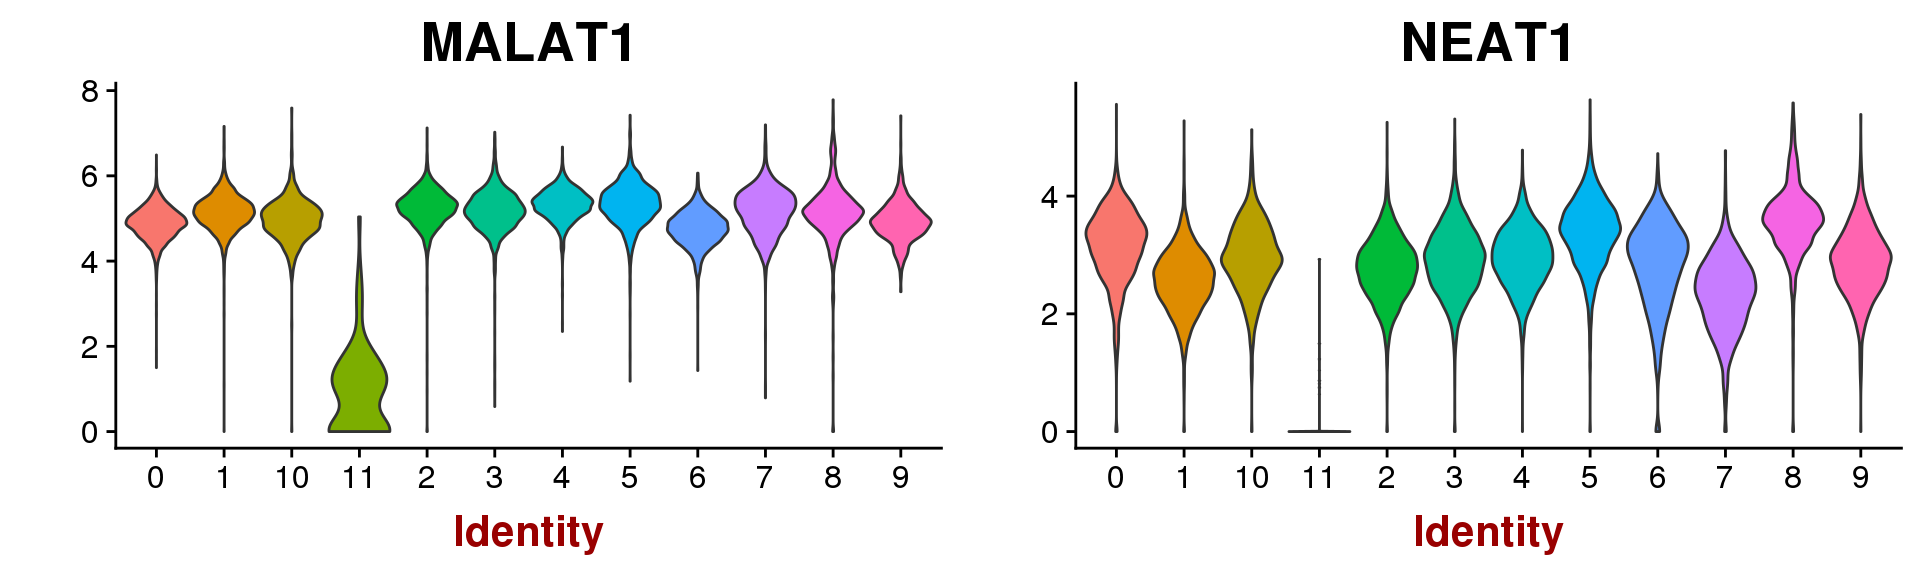
Expand here to see past versions of fig5-1.png:
| Version | Author | Date |
|---|---|---|
| 387bfa6 | PytrikFolkertsma | 2018-11-11 |
Metadata feature plots
FeaturePlot(seurobj, reduction.use='tsne', features.plot = 'nUMI', cols.use=c('grey', 'blue'), no.legend=F)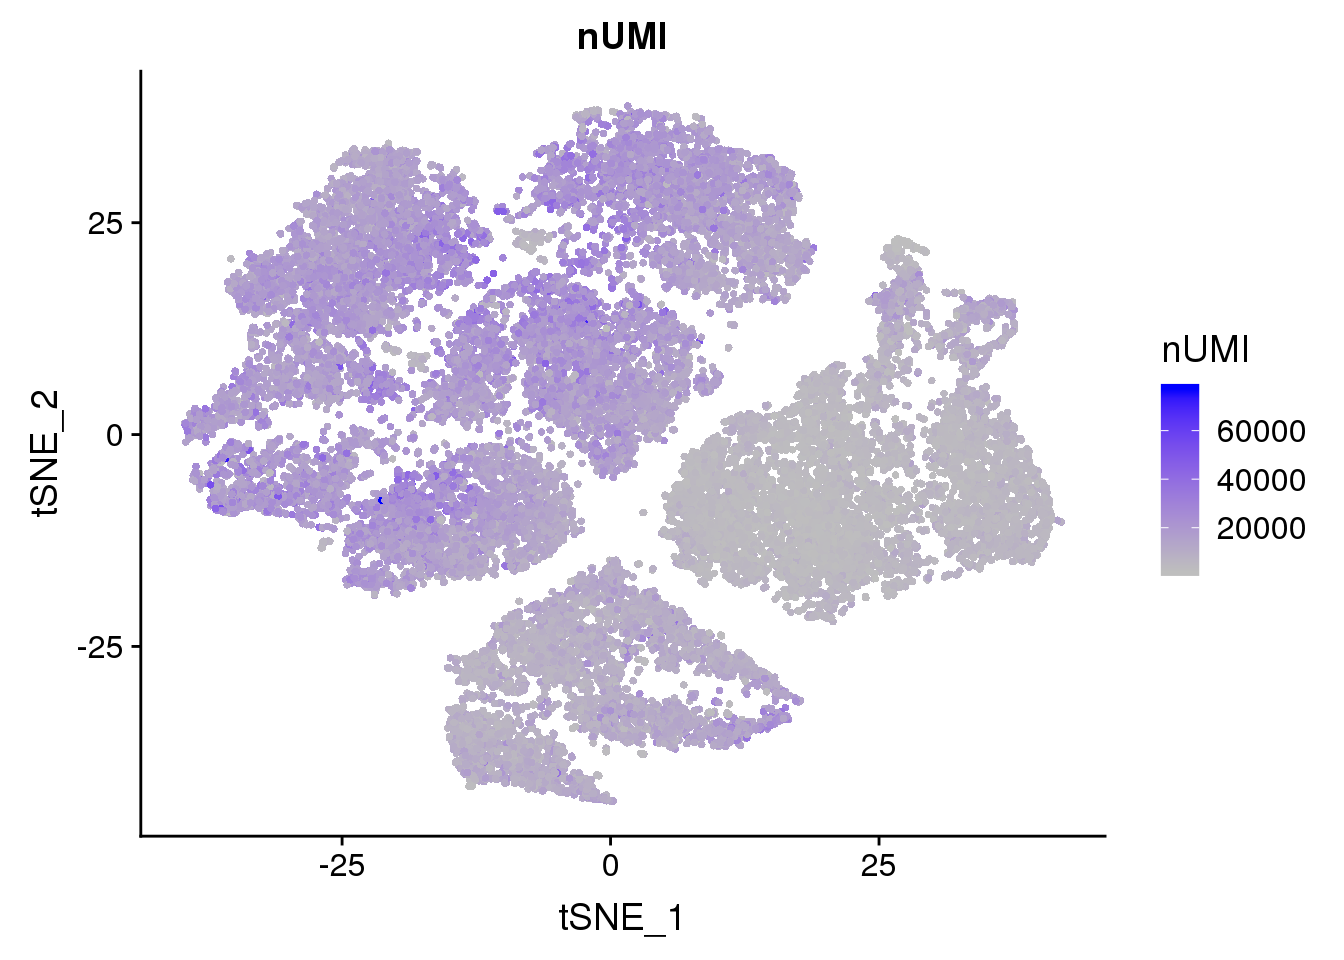
Expand here to see past versions of unnamed-chunk-8-1.png:
| Version | Author | Date |
|---|---|---|
| 387bfa6 | PytrikFolkertsma | 2018-11-11 |
FeaturePlot(seurobj, features.plot = 'percent.mito', cols.use=c('grey', 'blue'), no.legend = F)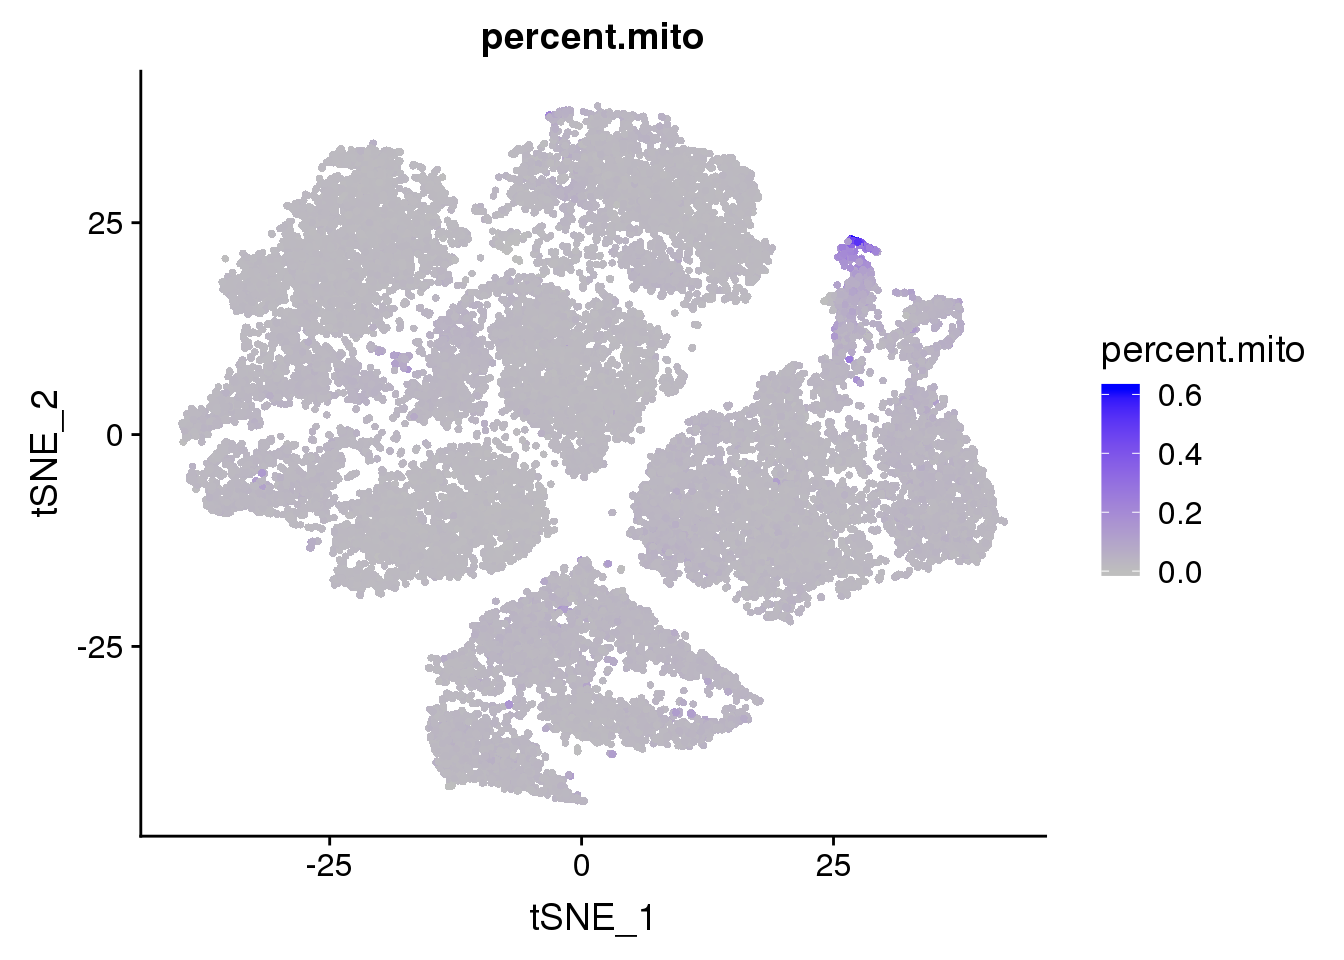
Expand here to see past versions of unnamed-chunk-9-1.png:
| Version | Author | Date |
|---|---|---|
| 387bfa6 | PytrikFolkertsma | 2018-11-11 |
FeaturePlot(seurobj, reduction.use='tsne', features.plot = 'nGene', cols.use=c('grey', 'blue'), no.legend = F)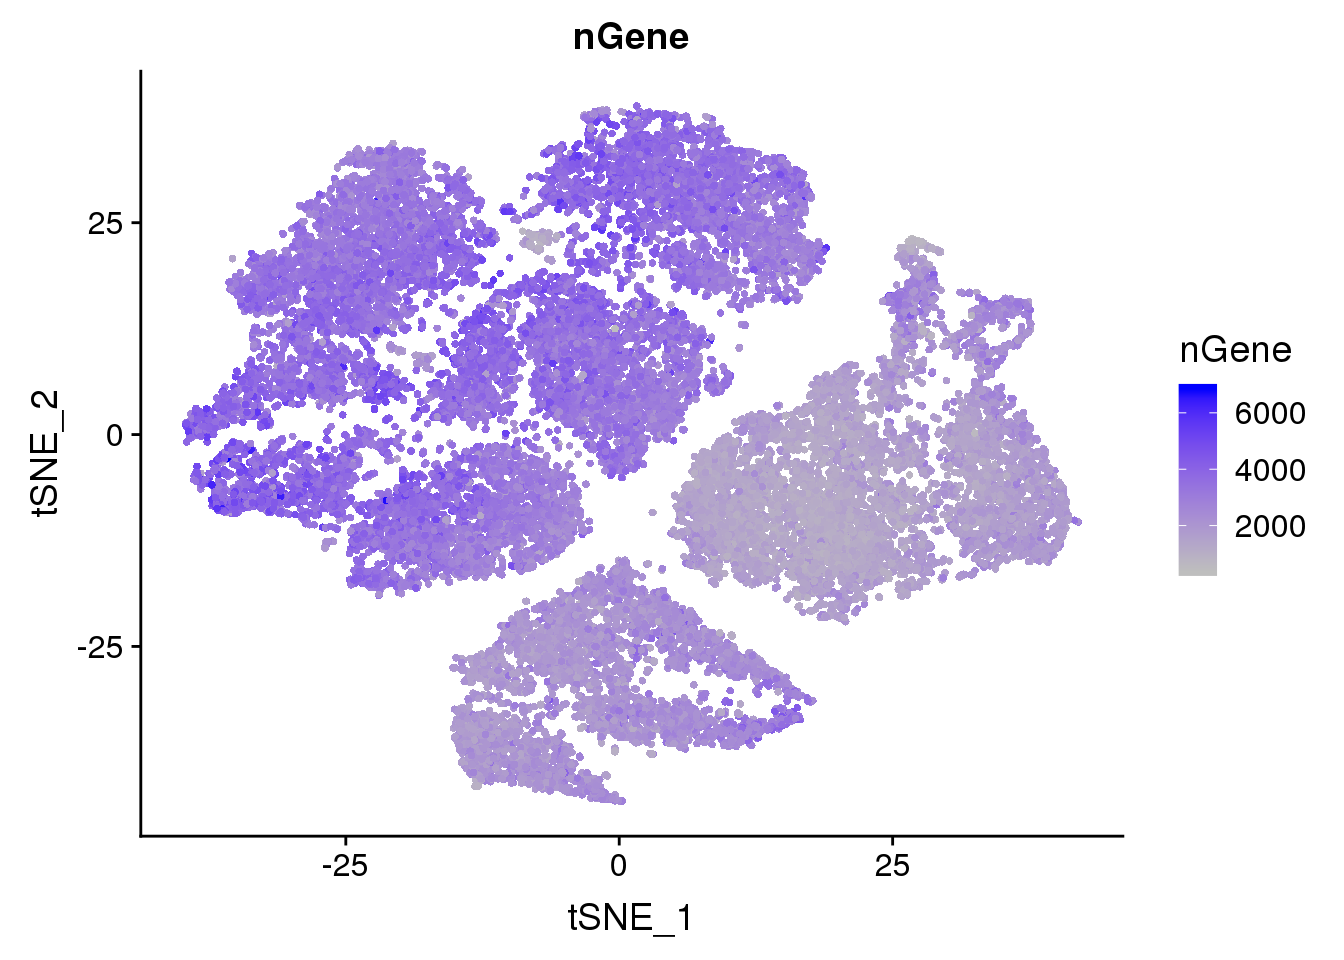
Expand here to see past versions of unnamed-chunk-10-1.png:
| Version | Author | Date |
|---|---|---|
| 387bfa6 | PytrikFolkertsma | 2018-11-11 |
Markergene expression
FeaturePlot(seurobj, reduction.use='tsne', features.plot = 'EBF2', cols.use=c('grey', 'blue'), no.legend = F)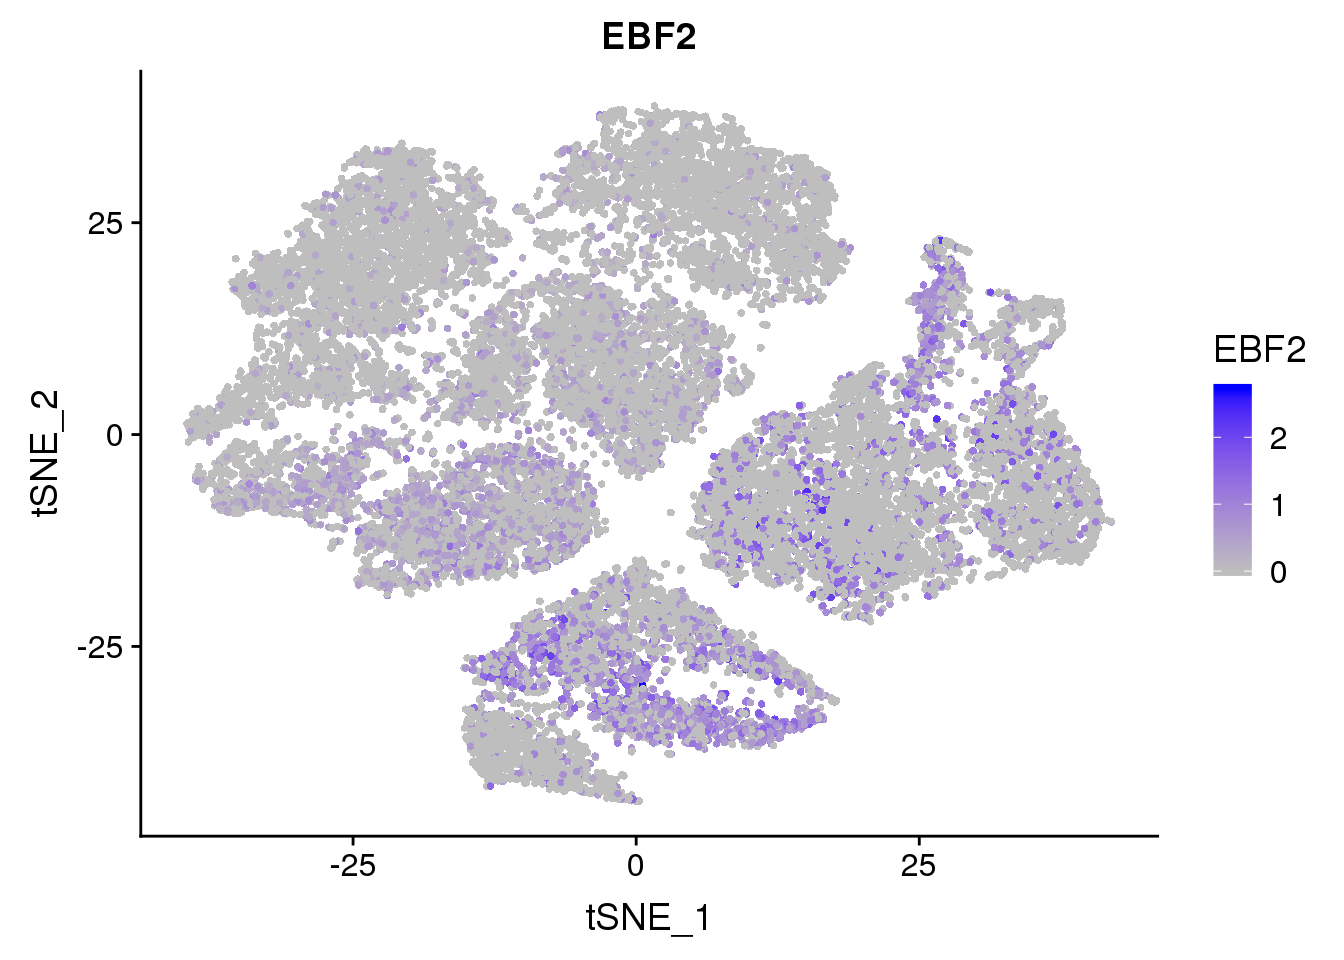
Expand here to see past versions of unnamed-chunk-11-1.png:
| Version | Author | Date |
|---|---|---|
| 387bfa6 | PytrikFolkertsma | 2018-11-11 |
FeaturePlot(seurobj, reduction.use='tsne', features.plot = 'TM4SF1', cols.use=c('grey', 'blue'), no.legend = F)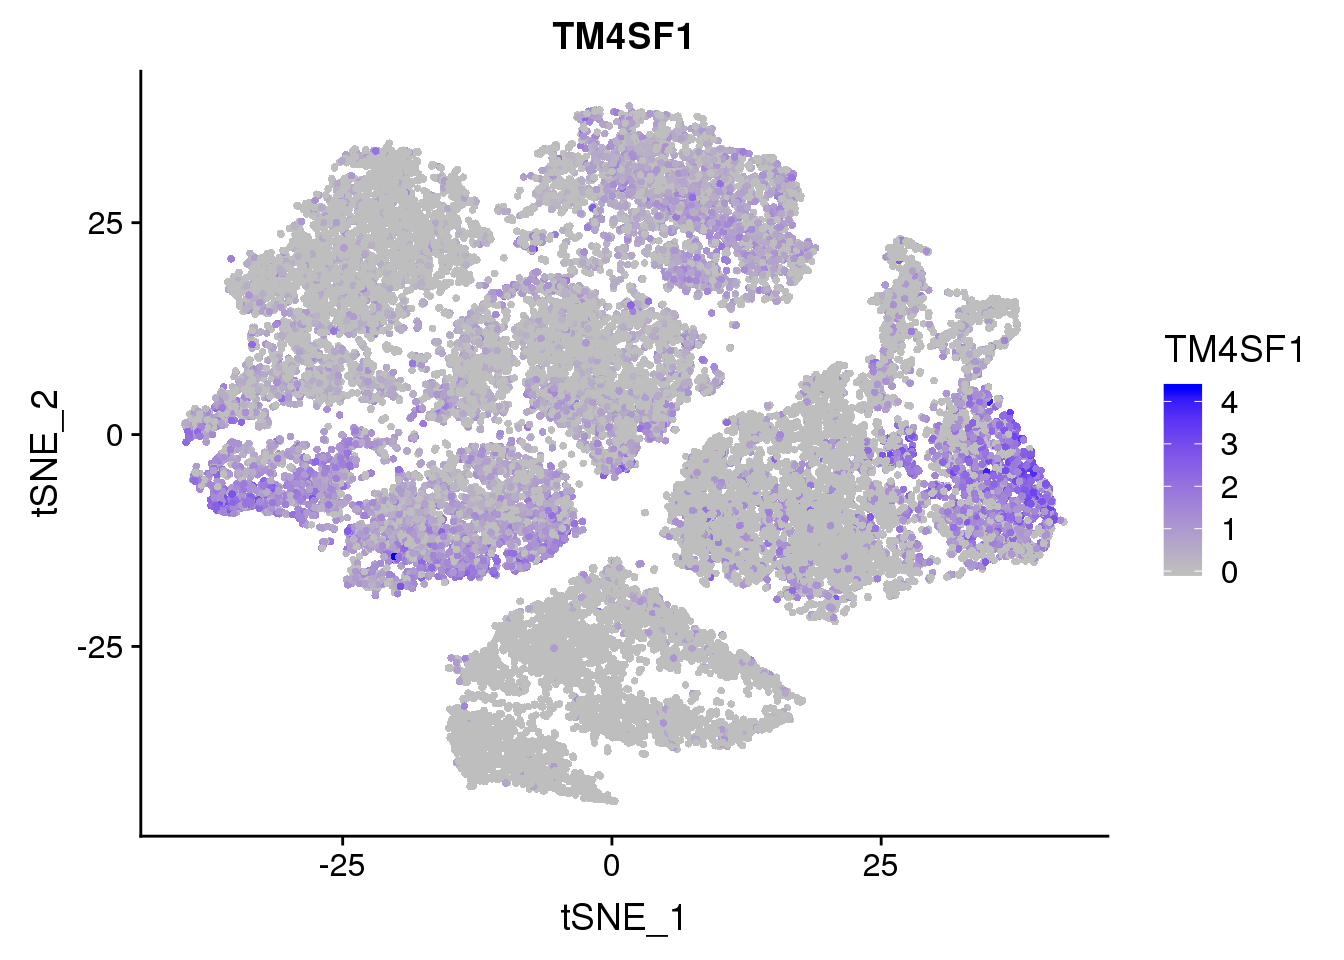
Expand here to see past versions of unnamed-chunk-12-1.png:
| Version | Author | Date |
|---|---|---|
| 387bfa6 | PytrikFolkertsma | 2018-11-11 |
FeaturePlot(seurobj, reduction.use='tsne', features.plot = 'LY6K', cols.use=c('grey', 'blue'), no.legend = F)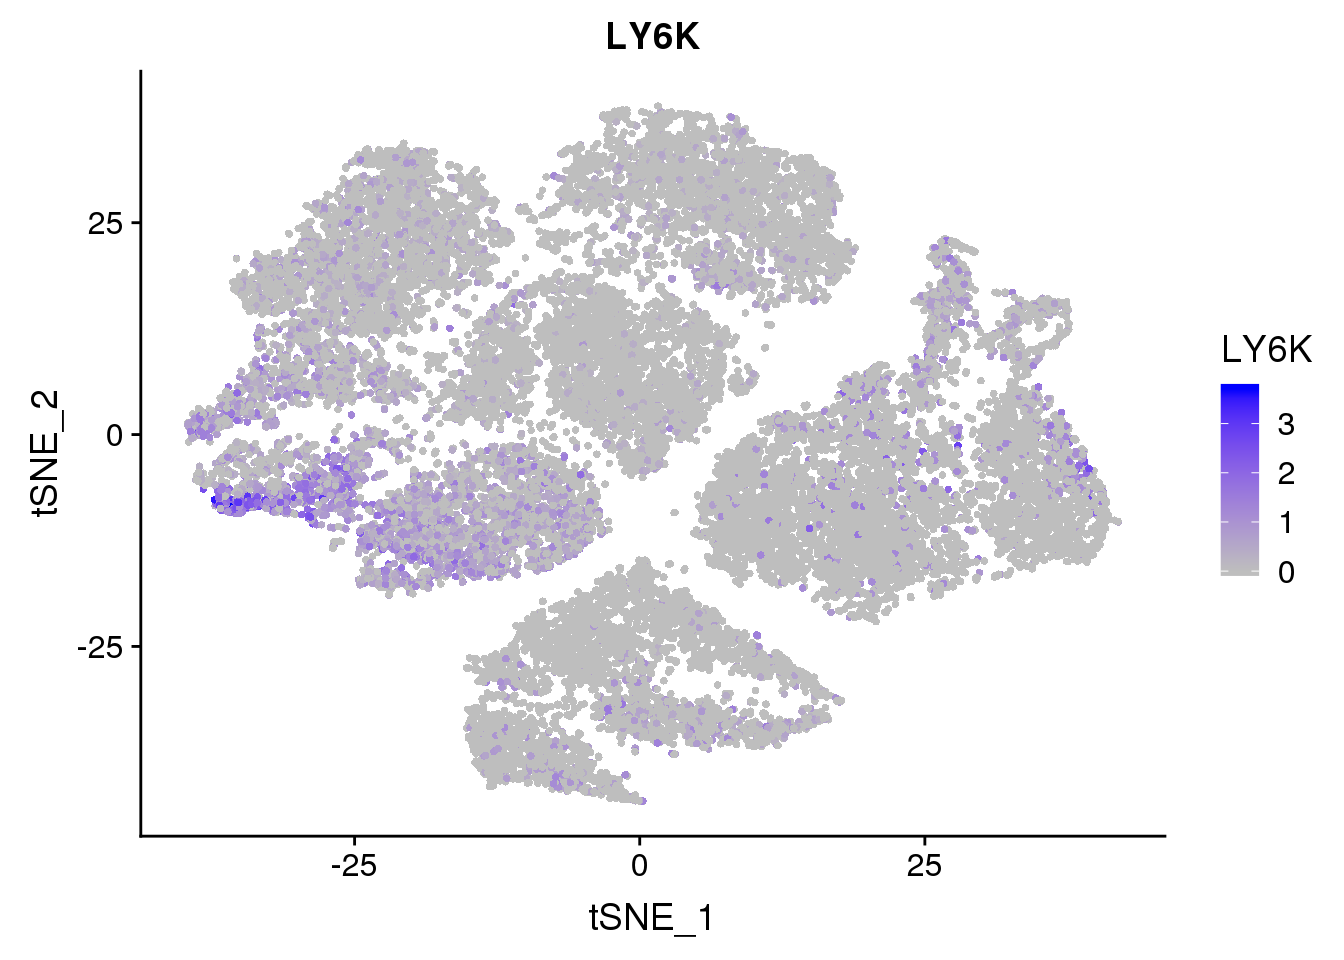
Expand here to see past versions of unnamed-chunk-13-1.png:
| Version | Author | Date |
|---|---|---|
| 387bfa6 | PytrikFolkertsma | 2018-11-11 |
FeaturePlot(seurobj, reduction.use='tsne', features.plot = 'PDGFRA', cols.use=c('grey', 'blue'), no.legend = F)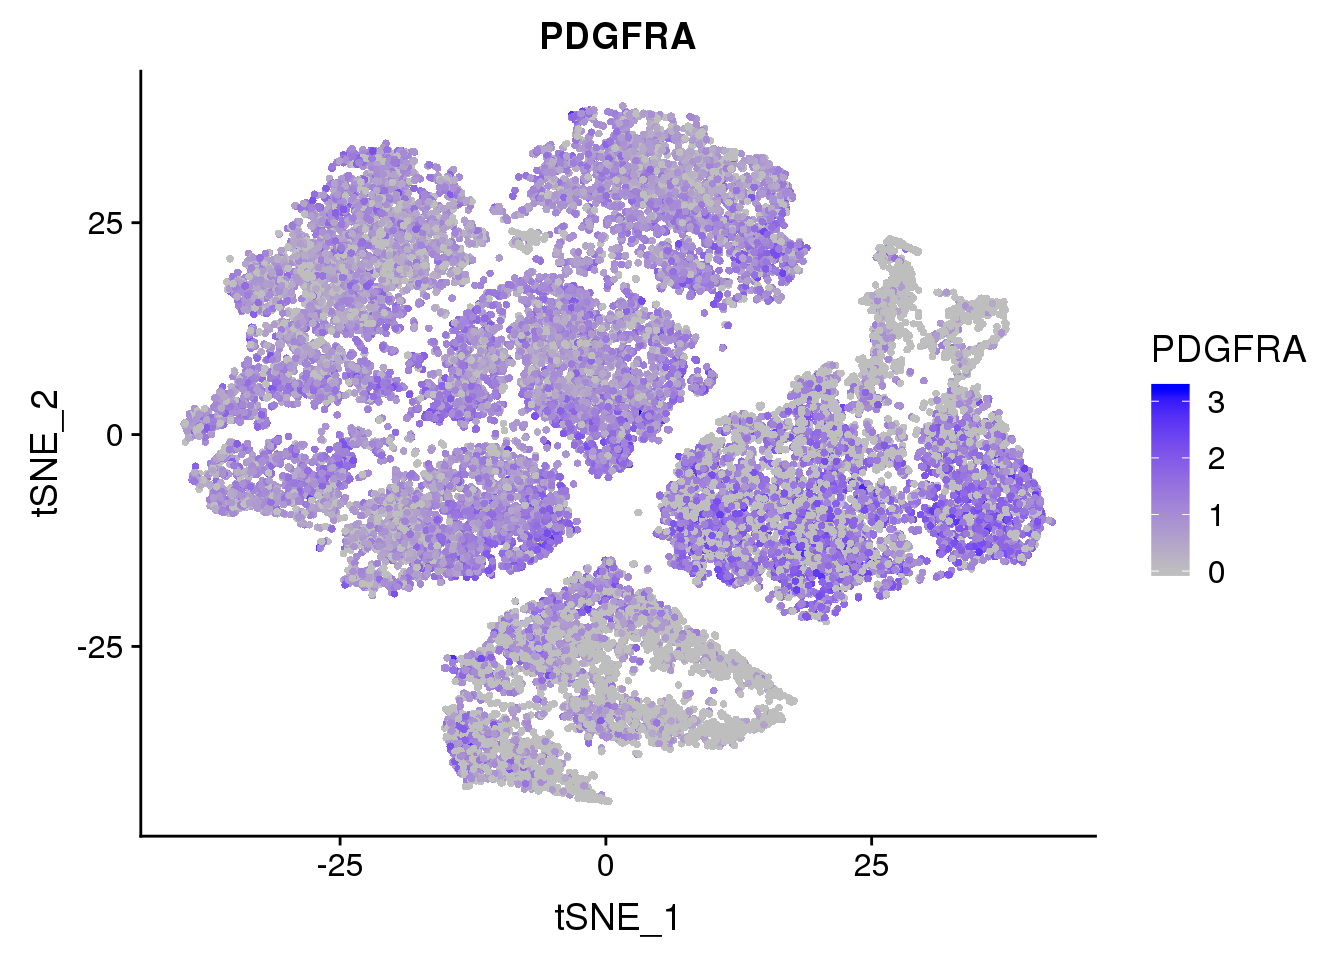
Expand here to see past versions of unnamed-chunk-14-1.png:
| Version | Author | Date |
|---|---|---|
| 387bfa6 | PytrikFolkertsma | 2018-11-11 |
Markers literature
Marker genes for mature brown/beige compared to white mentioned by Seale 2016: UCP1, DIO2, CIDEA, PPARGC1A, PPARA, COX7A1, COX8B, PRDM16, EBF2. \
VlnPlot(seurobj, features.plot=c('UCP1', 'DIO2', 'CIDEA', 'PPARGC1A', 'PPARA', 'COX7A1', 'PRDM16', 'EBF2'), group.by='timepoint', point.size.use = -1, nCol=2)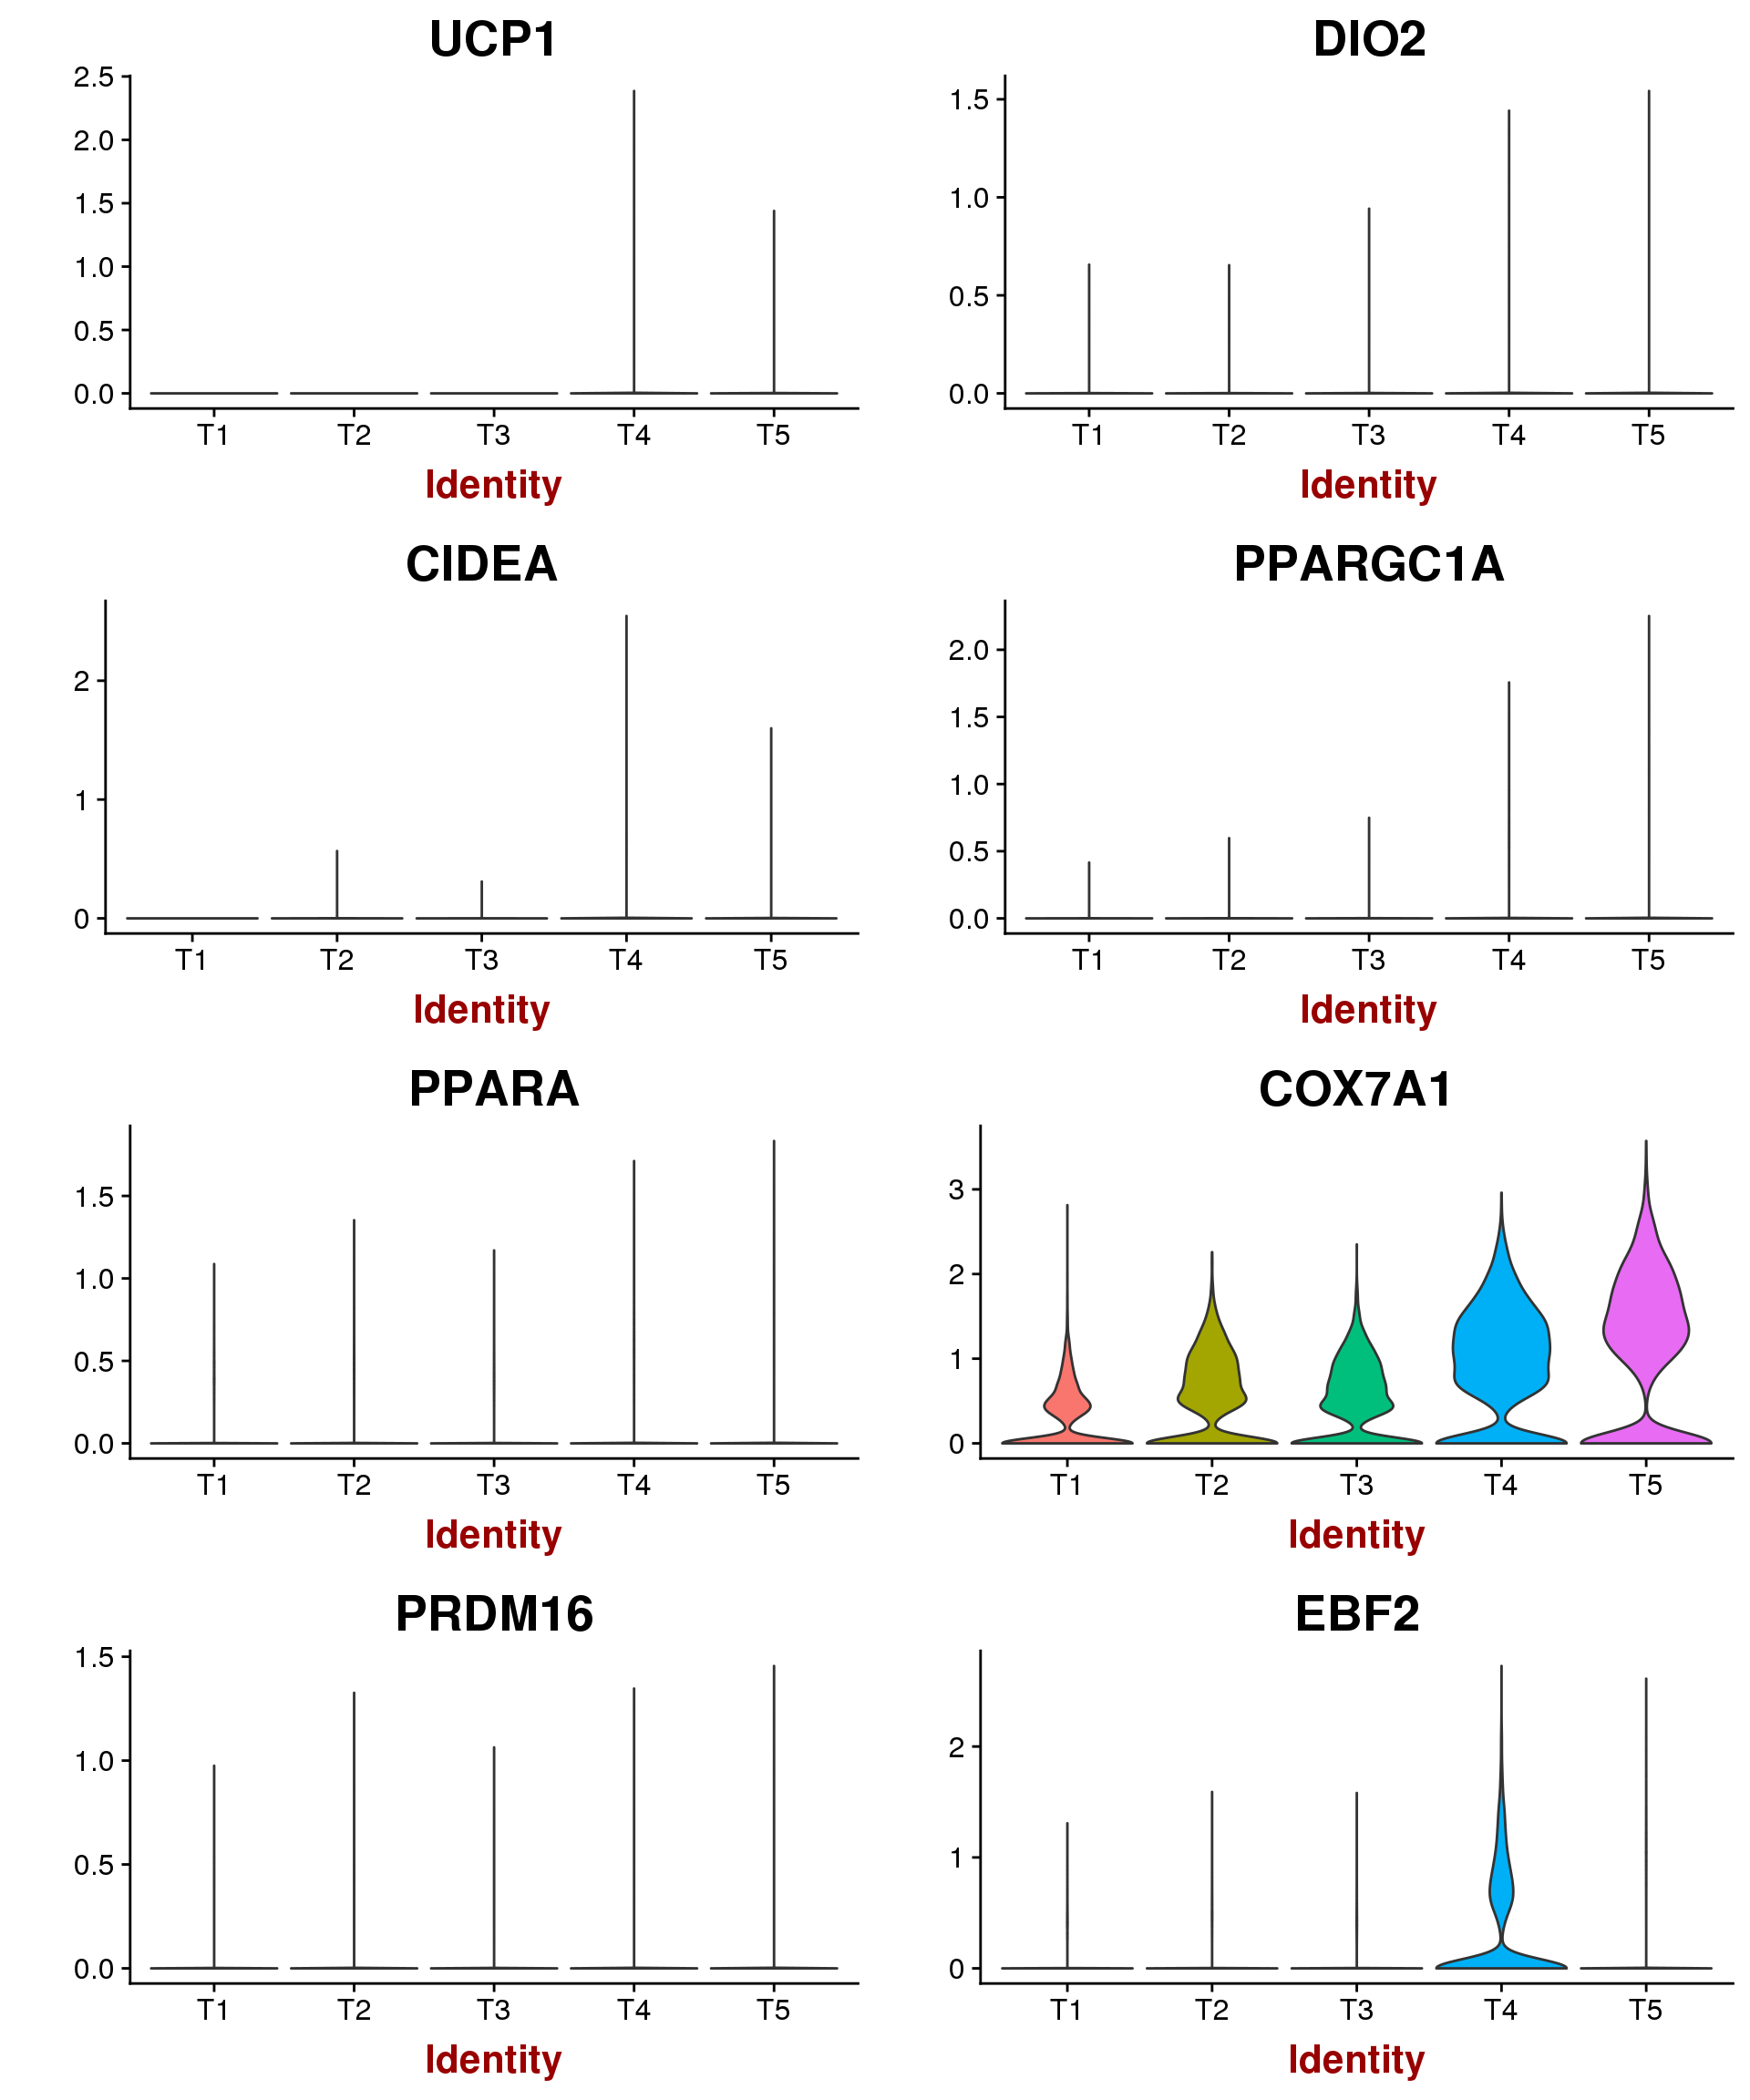
Expand here to see past versions of fig6-1.png:
| Version | Author | Date |
|---|---|---|
| 387bfa6 | PytrikFolkertsma | 2018-11-11 |
Based on PDGFRα or PDGFRβ deletion and ectopic expression experiments, we conclude that the PDGFRα/PDGFRβ signaling balance determines progenitor commitment to beige (PDGFRα) or white (PDGFRβ) adipogenesis. Our study suggests that adipocyte lineage specification and metabolism can be modulated through PDGFR signaling. http://dev.biologists.org/content/145/1/dev155861.long
FeaturePlot(seurobj, reduction.use='pca', features.plot=c('PDGFRA', 'PDGFRB'), pt.size=1, cols.use=c('gray', 'blue'), no.legend=F, nCol=2)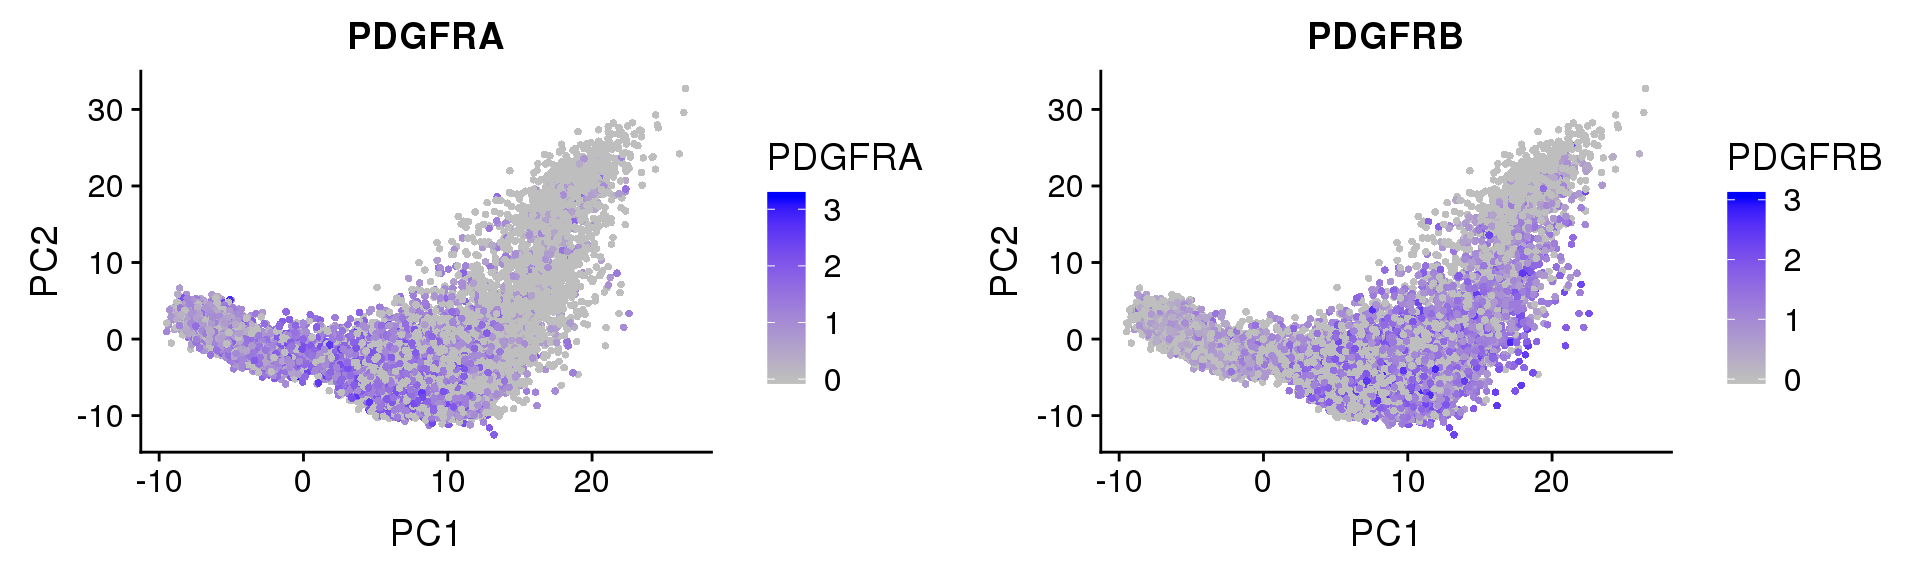
Expand here to see past versions of fig7-1.png:
| Version | Author | Date |
|---|---|---|
| 387bfa6 | PytrikFolkertsma | 2018-11-11 |
FeaturePlot(seurobj, reduction.use='tsne', features.plot=c('PDGFRA', 'PDGFRB'), pt.size=1, cols.use=c('gray', 'blue'), no.legend=F, nCol=2)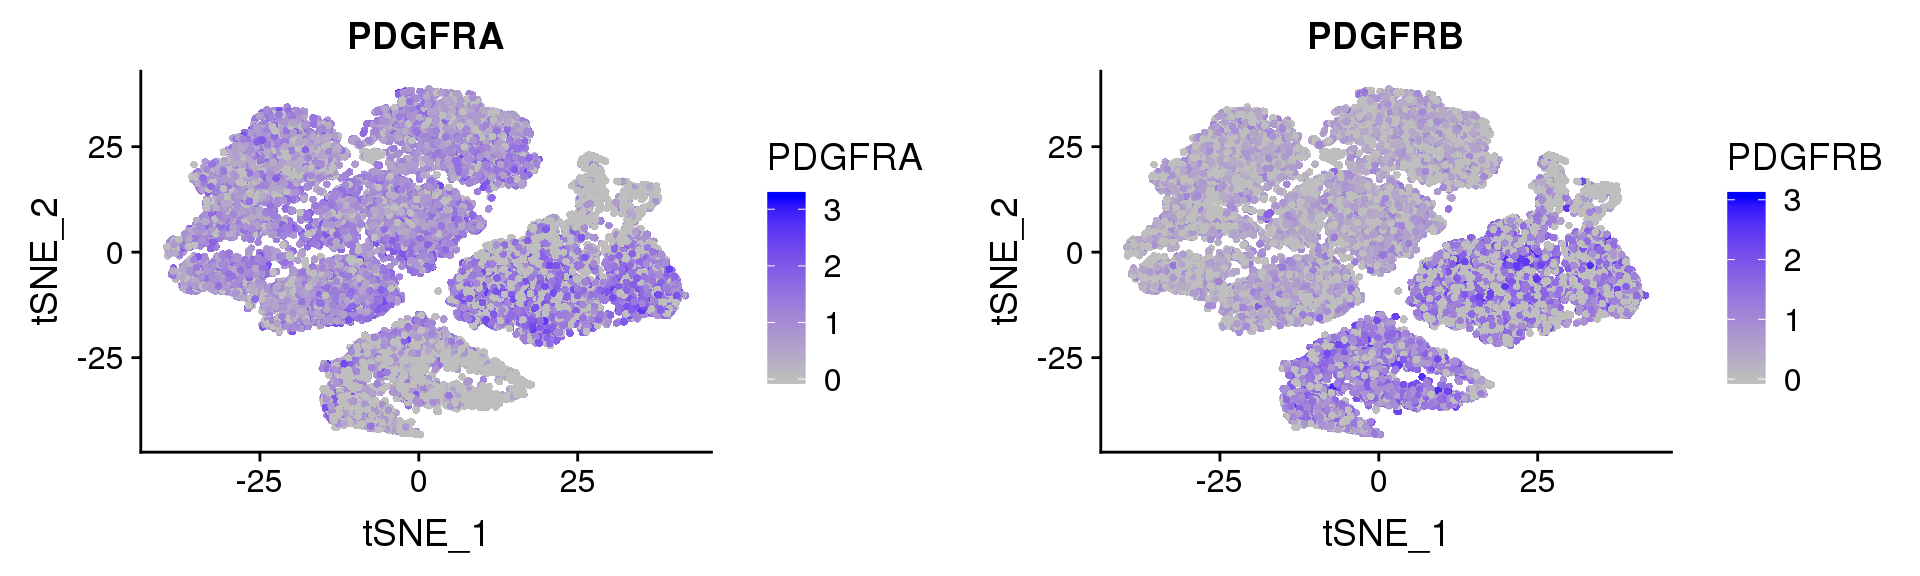
Expand here to see past versions of fig8-1.png:
| Version | Author | Date |
|---|---|---|
| 387bfa6 | PytrikFolkertsma | 2018-11-11 |
GenePlot(SetAllIdent(seurobj, id='timepoint'), gene1='PDGFRA', gene2='PDGFRB', cex.use=0.5)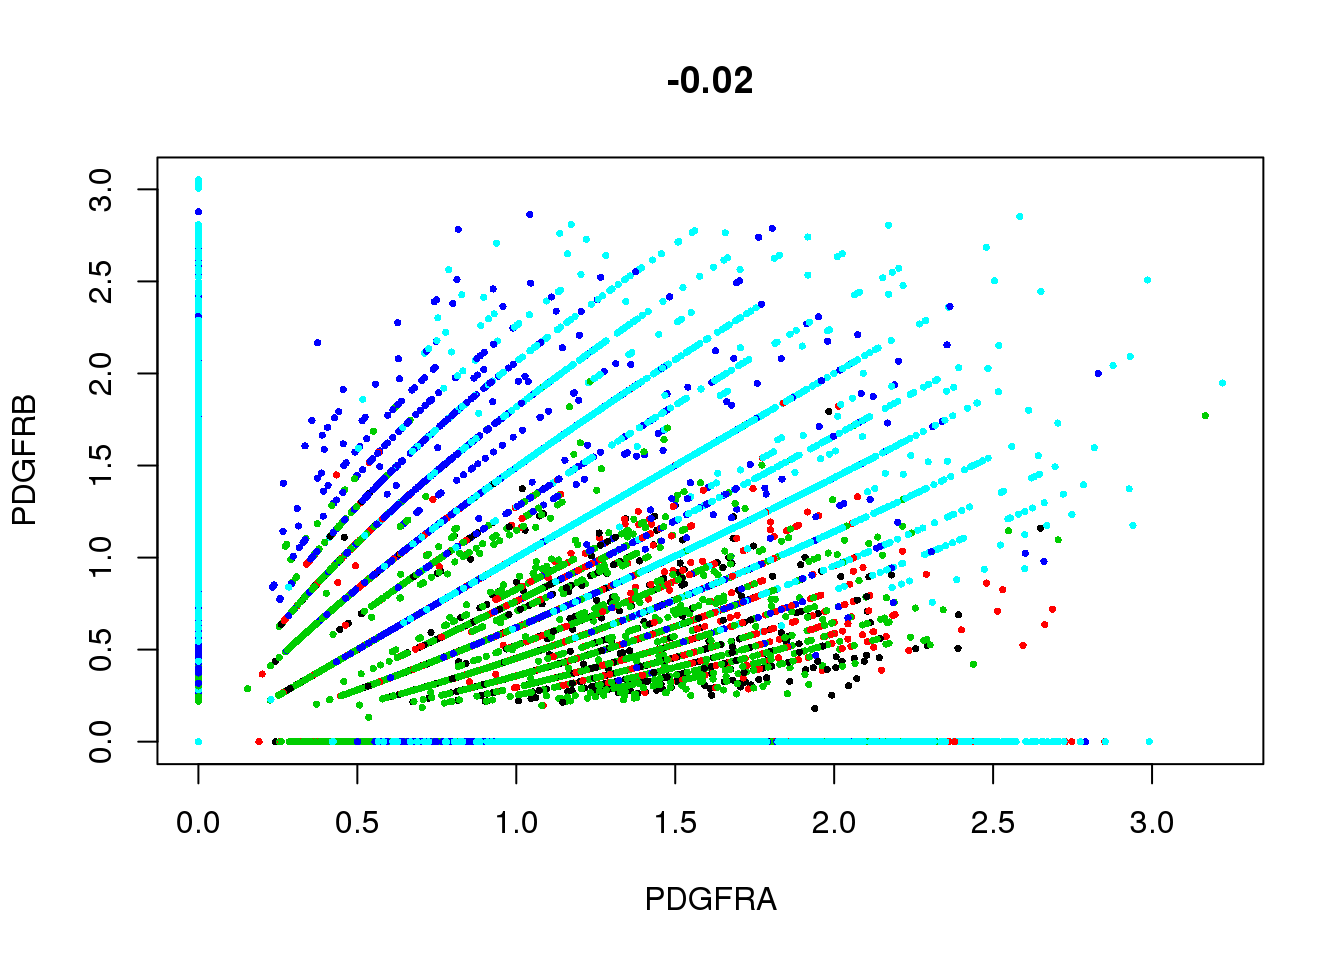
Expand here to see past versions of unnamed-chunk-15-1.png:
| Version | Author | Date |
|---|---|---|
| 387bfa6 | PytrikFolkertsma | 2018-11-11 |
Figures for report
fig <- plot_grid(
  PCAPlot(seurobj, group.by='timepoint', pt.size=0.1),
  TSNEPlot(seurobj, group.by='timepoint', pt.size=0.1),
  labels='auto', nrow=1
)
#save_plot("../plots/180831_pca_tsne.pdf", fig, base_width=12, base_height=5)
fig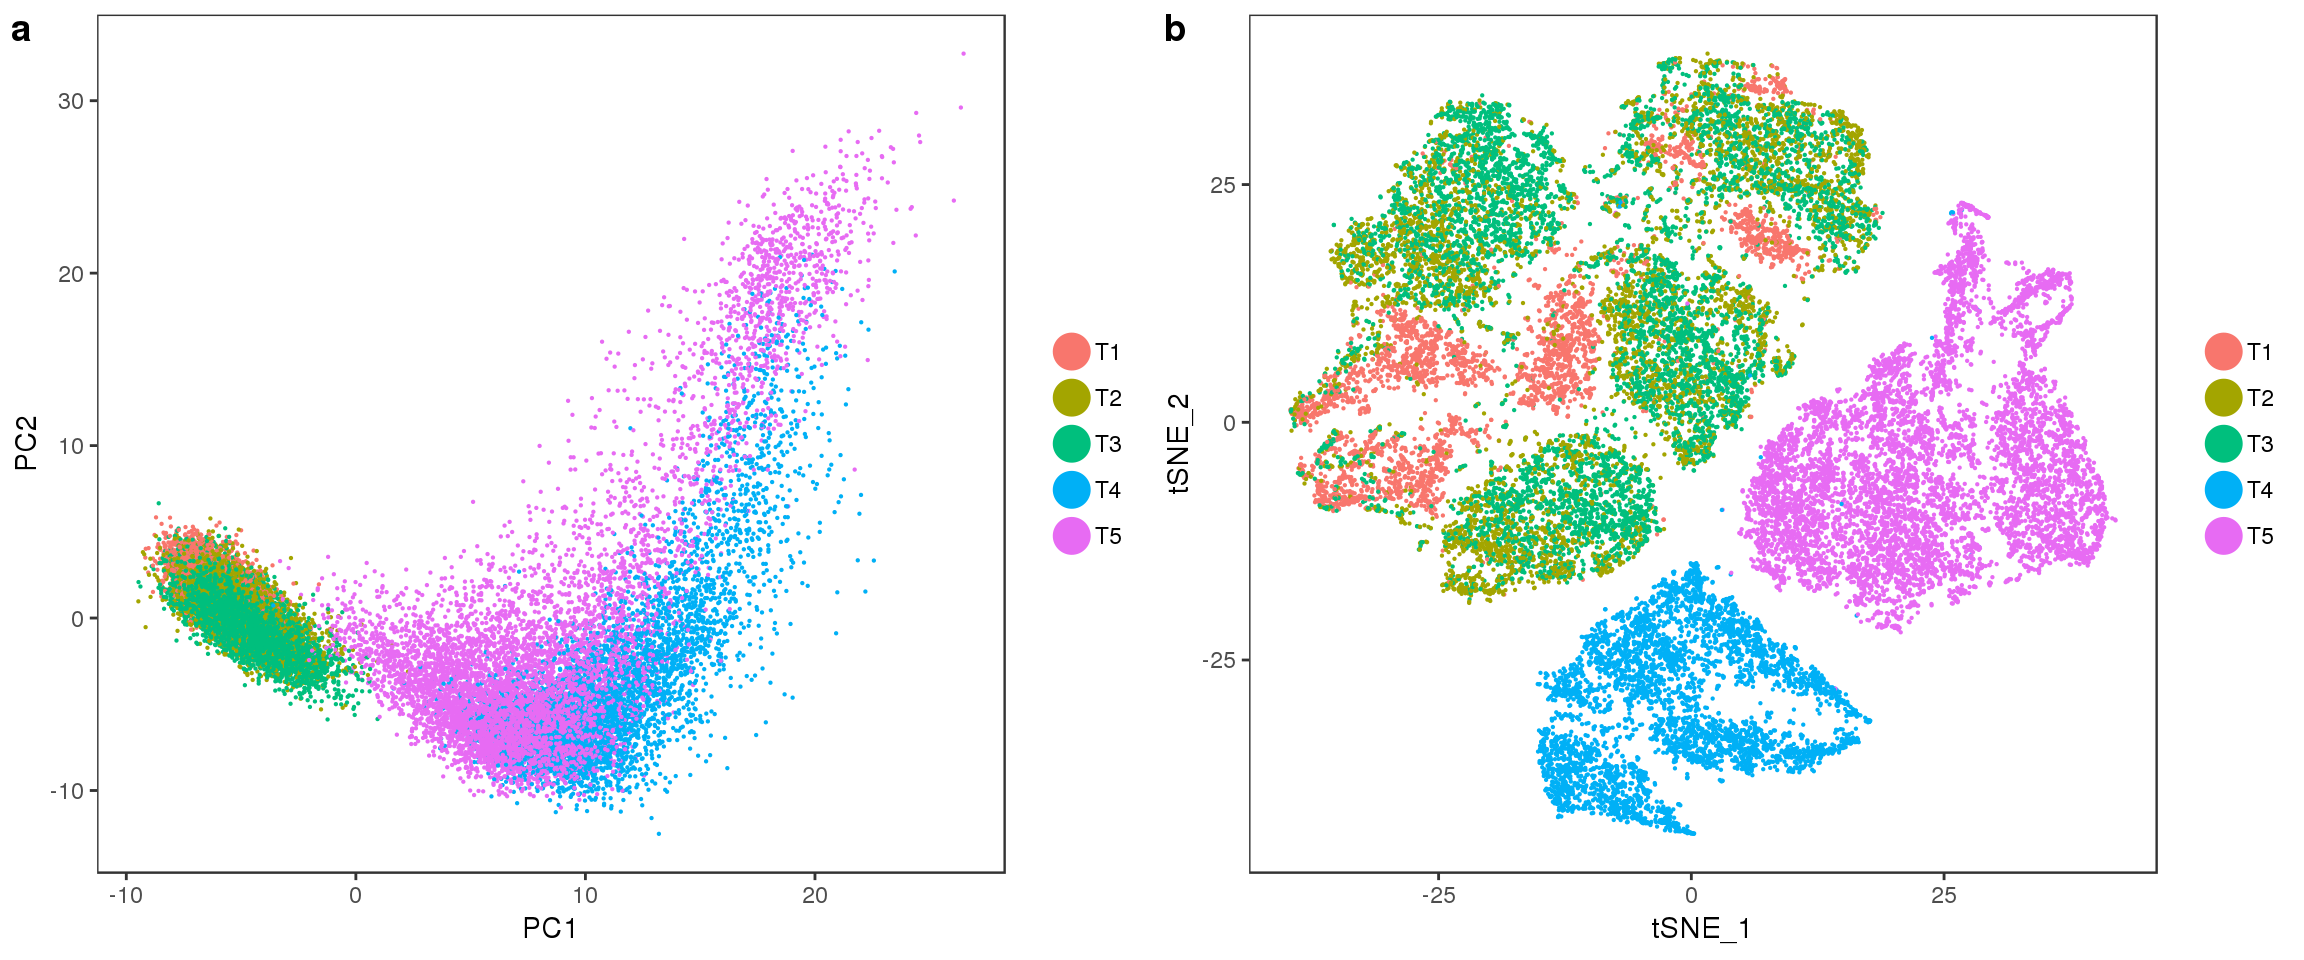
sfig1 <- PCElbowPlot(seurobj, num.pc=50) #TSNE+clustering run on 21 PC's.
#save_plot("../plots/supplementary_figures/sfig_180831_pcelbow.pdf", sfig1, base_width=6, base_height=4)
sfig1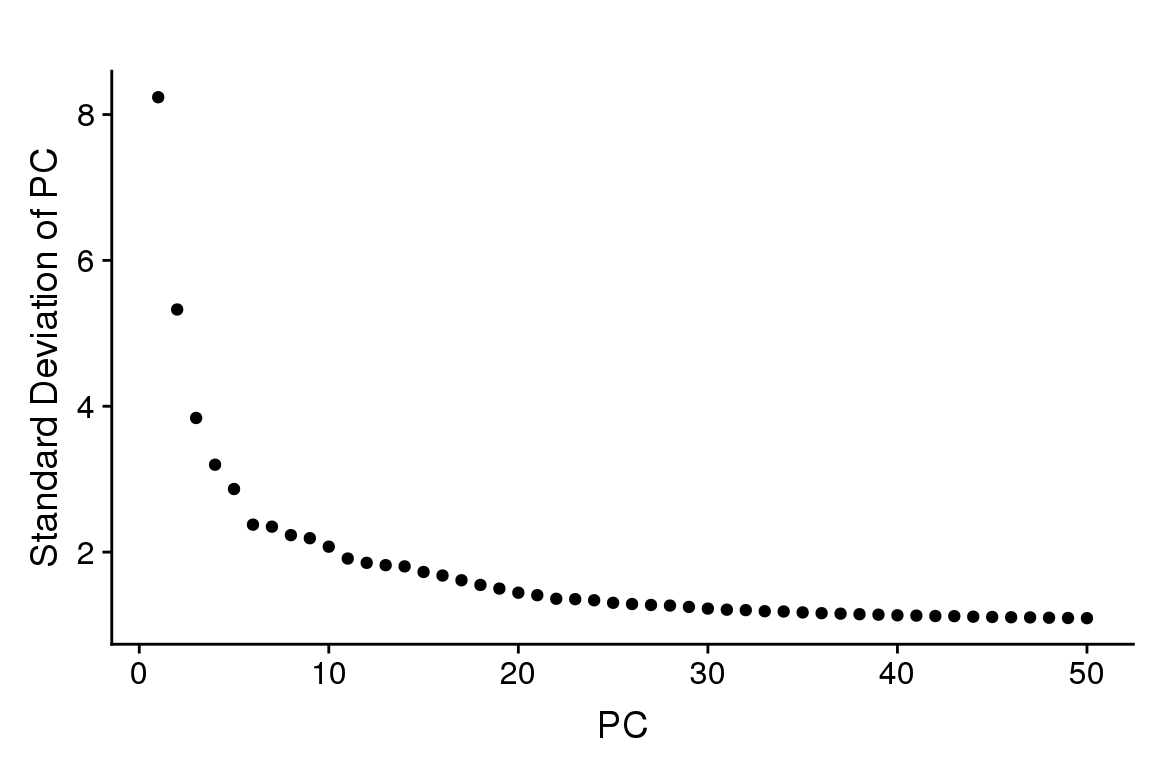
sfig2 <- TSNEPlot(seurobj, group.by='Phase', pt.size=0.1)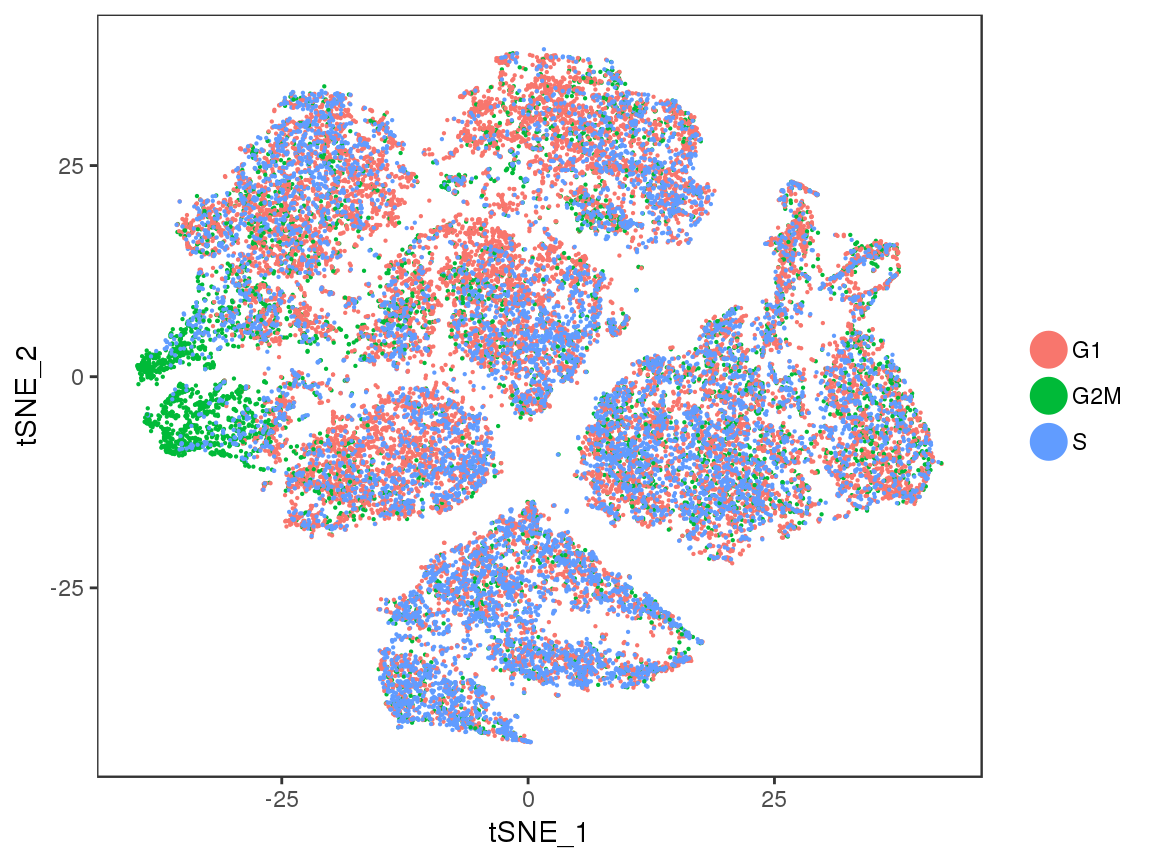
#save_plot("../plots/supplementary_figures/sfig_180831_tsne_cellcycle.pdf", sfig2, base_width=6, base_height=4.5)
sfig2
sfig3 <- plot_grid(
  VlnPlot(seurobj, c("nGene"), group.by='timepoint', point.size.use=-1),
  VlnPlot(seurobj, c("nUMI"), group.by='timepoint', point.size.use=-1),
  VlnPlot(seurobj, c("percent.mito"), group.by='timepoint', point.size.use=-1),
  labels='auto', nrow=1
)
#save_plot("../plots/supplementary_figures/sfig_180831_ngene-numi-pm.pdf", sfig3, base_width=12, base_height=3)
sfig3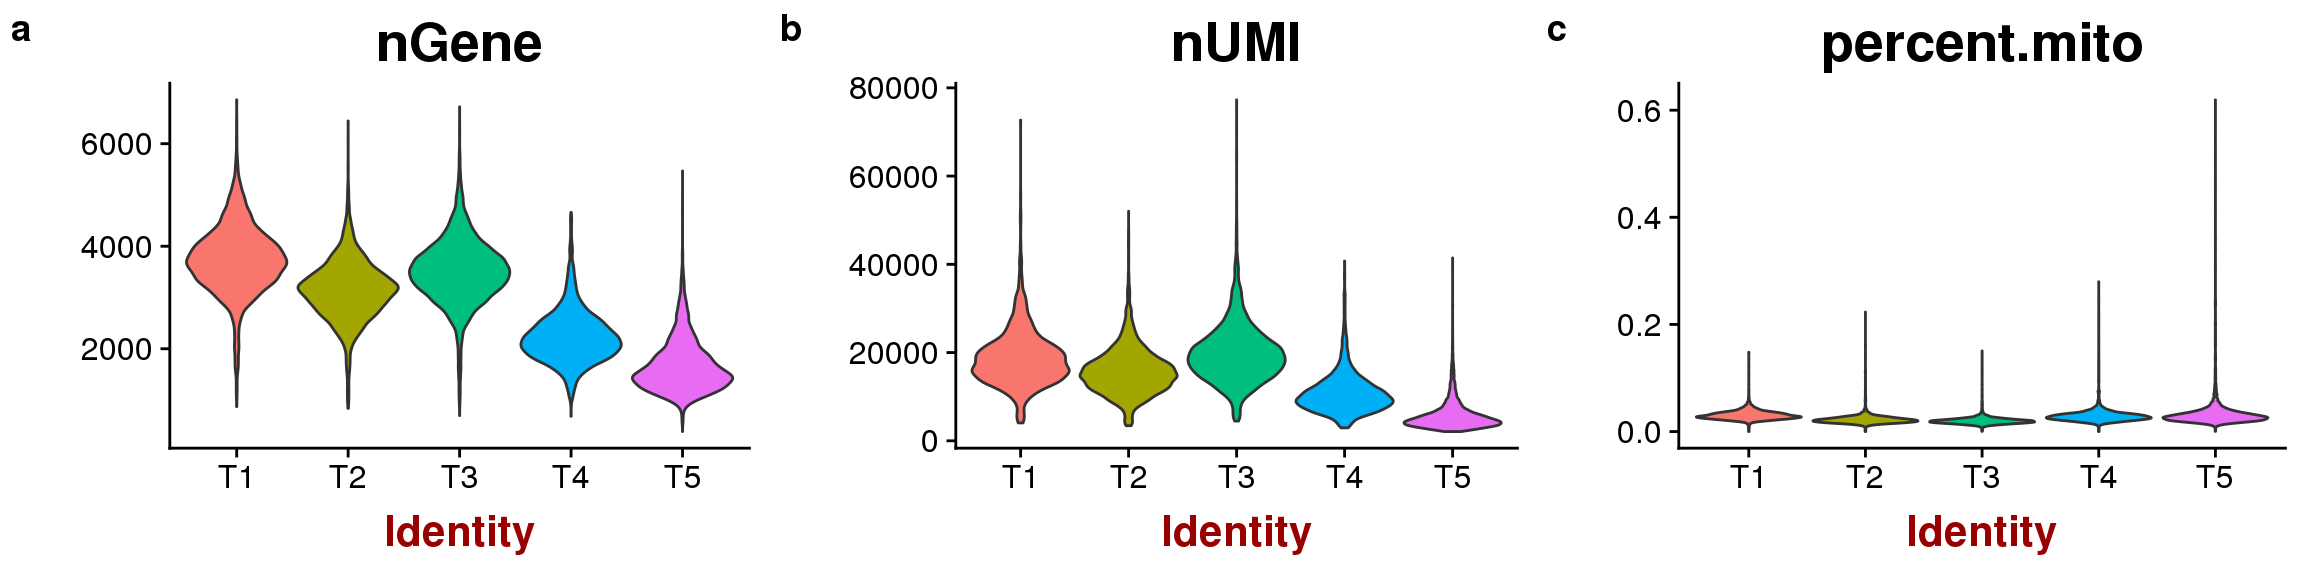
Session information
sessionInfo()R version 3.4.3 (2017-11-30)
Platform: x86_64-redhat-linux-gnu (64-bit)
Running under: Storage
Matrix products: default
BLAS/LAPACK: /usr/lib64/R/lib/libRblas.so
locale:
[1] LC_CTYPE=en_US.UTF-8 LC_NUMERIC=C
[3] LC_TIME=en_US.UTF-8 LC_COLLATE=en_US.UTF-8
[5] LC_MONETARY=en_US.UTF-8 LC_MESSAGES=en_US.UTF-8
[7] LC_PAPER=en_US.UTF-8 LC_NAME=C
[9] LC_ADDRESS=C LC_TELEPHONE=C
[11] LC_MEASUREMENT=en_US.UTF-8 LC_IDENTIFICATION=C
attached base packages:
[1] stats graphics grDevices utils datasets methods base
other attached packages:
[1] bindrcpp_0.2.2 dplyr_0.7.6 Seurat_2.3.4 Matrix_1.2-14
[5] cowplot_0.9.3 ggplot2_3.0.0
loaded via a namespace (and not attached):
[1] Rtsne_0.13 colorspace_1.3-2 class_7.3-14
[4] modeltools_0.2-22 ggridges_0.5.0 mclust_5.4.1
[7] rprojroot_1.3-2 htmlTable_1.12 base64enc_0.1-3
[10] rstudioapi_0.7 proxy_0.4-22 flexmix_2.3-14
[13] bit64_0.9-7 mvtnorm_1.0-8 codetools_0.2-15
[16] splines_3.4.3 R.methodsS3_1.7.1 robustbase_0.93-2
[19] knitr_1.20 Formula_1.2-3 jsonlite_1.5
[22] workflowr_1.1.1 ica_1.0-2 cluster_2.0.7-1
[25] kernlab_0.9-27 png_0.1-7 R.oo_1.22.0
[28] compiler_3.4.3 httr_1.3.1 backports_1.1.2
[31] assertthat_0.2.0 lazyeval_0.2.1 lars_1.2
[34] acepack_1.4.1 htmltools_0.3.6 tools_3.4.3
[37] igraph_1.2.2 gtable_0.2.0 glue_1.3.0
[40] RANN_2.6 reshape2_1.4.3 Rcpp_0.12.18
[43] trimcluster_0.1-2.1 gdata_2.18.0 ape_5.1
[46] nlme_3.1-137 iterators_1.0.10 fpc_2.1-11.1
[49] gbRd_0.4-11 lmtest_0.9-36 stringr_1.3.1
[52] irlba_2.3.2 gtools_3.8.1 DEoptimR_1.0-8
[55] MASS_7.3-50 zoo_1.8-3 scales_1.0.0
[58] doSNOW_1.0.16 parallel_3.4.3 RColorBrewer_1.1-2
[61] yaml_2.2.0 reticulate_1.10 pbapply_1.3-4
[64] gridExtra_2.3 rpart_4.1-13 segmented_0.5-3.0
[67] latticeExtra_0.6-28 stringi_1.2.4 foreach_1.4.4
[70] checkmate_1.8.5 caTools_1.17.1.1 bibtex_0.4.2
[73] Rdpack_0.9-0 SDMTools_1.1-221 rlang_0.2.2
[76] pkgconfig_2.0.2 dtw_1.20-1 prabclus_2.2-6
[79] bitops_1.0-6 evaluate_0.11 lattice_0.20-35
[82] ROCR_1.0-7 purrr_0.2.5 bindr_0.1.1
[85] labeling_0.3 htmlwidgets_1.2 bit_1.1-14
[88] tidyselect_0.2.4 plyr_1.8.4 magrittr_1.5
[91] R6_2.2.2 snow_0.4-2 gplots_3.0.1
[94] Hmisc_4.1-1 pillar_1.3.0 whisker_0.3-2
[97] foreign_0.8-70 withr_2.1.2 fitdistrplus_1.0-9
[100] mixtools_1.1.0 survival_2.42-6 nnet_7.3-12
[103] tsne_0.1-3 tibble_1.4.2 crayon_1.3.4
[106] hdf5r_1.0.0 KernSmooth_2.23-15 rmarkdown_1.10
[109] grid_3.4.3 data.table_1.11.4 git2r_0.23.0
[112] metap_1.0 digest_0.6.15 diptest_0.75-7
[115] tidyr_0.8.1 R.utils_2.7.0 stats4_3.4.3
[118] munsell_0.5.0 This reproducible R Markdown analysis was created with workflowr 1.1.1